tions in sampling techniques that may exist
30
between different research groups and to en-
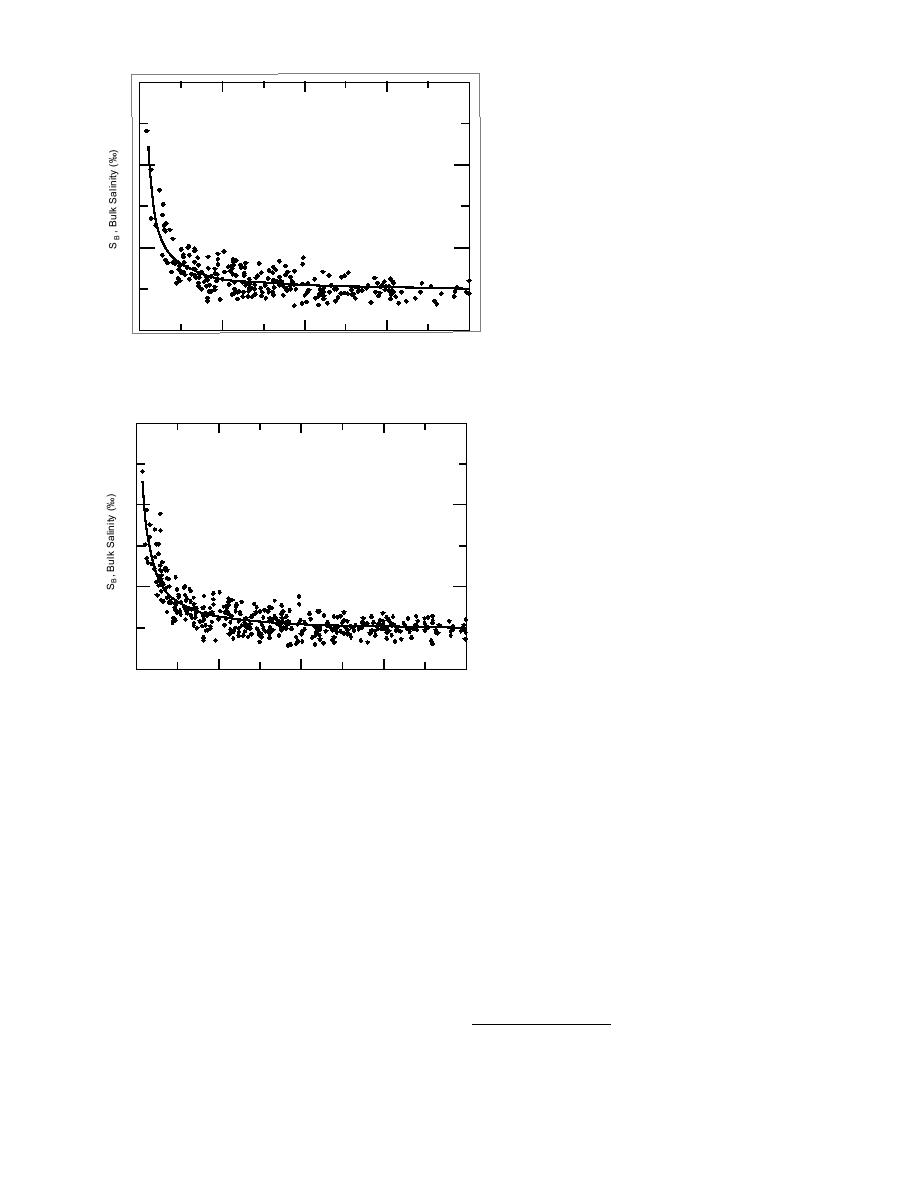
S B = 4.644 + 86.660/TF
sure that the ice sampled grew in seawater of
r 2 = 0.683
the same salinity. In the comparison between
S D = 1.46
this data set and the Beaufort Sea data, it was
20
found that the effect of seawater salinity on
ice salinity was not statistically discernible.
Therefore, it seems reasonable to combine
the Antarctic SB vs. TF data of Jeffries (1994)
with the Antarctic data of Fedotov (1973),
10
Wakatsuchi (1983), Gow et al. (1987),
Makshtas (1984), Eicken (1992), Gow et al.
(1992), Ackley et al. (1993), and Veazey et al.
(1994). These data, 315 points, are plotted in
Figure 17. There is considerable scatter in the
0
50
100
150
200
data, which can be due to a number of fac-
T F , Floe Thickness (cm)
Figure 17. Antarctic first-year sea-ice bulk salinity vs. floe tors: natural growth rate variations (Fig. 16),
brine drainage during coring and process-
thickness data collected from several sources.
ing, errors in salinity determination, varia-
30
tions in ice type (infiltrated snow, frazil, plate-
let and columnar ice), and morphology, such
SB = 4.606 + 91.603/TF
as layered rafted ice. The salinity errors could
r 2 = 0.730
arise from errors in measuring the ice-core
S D = 1.47
temperature and melt conductivity, measure-
20
ments that are required for calculating ice
salinity. The regression curve through the data
in Figure 17 probably gives a better assess-
ment of Antarctic sea ice SB vs. TF than the
curve in Figure 14 because of the increase in
10
the number of data points from 74 to 315.
Combining now the data in Figure 17 with
the Arctic data in Figure 11 along with first-
year sea ice SB vs. TF data collected at Thule,
0
Greenland, and Hopedale, Labrador (Weeks
50
100
150
200
TF , Floe Thickness (cm)
and Anderson 1958), Fram Strait (Gow et al.
Figure 18. All Arctic and Antarctic first-year sea-ice bulk 1987), Port Clarence, Alaska (Kovacs and
salinity vs. floe thickness data compiled from numerous sources. Kalafut 1977), and Elson Lagoon, Pt. Barrow,
Alaska (L.H. Shapiro* 1994, personal contri-
bution, eight measurements), the distribu-
latter, of course, affects the salinity of the ice. This
tion shown in Figure 18 is obtained. Interestingly,
is illustrated in Figure 16, which shows the stable
the regression curve through the combined data
salinity of sea ice vs. growth rate. The data,
gives nearly the same SB vs. TF values as the curve
from measurements made on Arctic and Antarc-
in Figure 17. For example, at 200 cm both equa-
tic sea ice (Nakawo and Sinha 1981, Wakatsuchi
tions give 5.07‰ for SB, while at 15 cm the differ-
1983), clearly reveal that the salinity of sea ice
ence is only 0.30‰. This is well within experi-
decreases exponentially with decreasing growth
mental error, and suggests that for most purposes
rate. Therefore, the growth rate coefficient for natu-
the bulk salinity vs. thickness of undeformed first-
ral sea ice is not a constant, but varies with ice
year sea ice grown in Arctic and Antarctic seawa-
thickness. The scale on the right side of Figure 16
ter with a salinity of about 31 to 34‰ will be very
shows the salinity ratio of the ice vs. growth rate.
similar. Refinements and standardization of sam-
As expected, this ratio is not a constant, but also
pling techniques may one day allow us to see the
varies with ice salinity.
In Figure 14 only the Antarctic sea ice data of
Jeffries (1994) were used, to eliminate any varia-
* Geophysical Institute, University of Alaska, Fairbanks.
10


 Previous Page
