30
ESTIMATING
ICE FLOE SALINITY
150
2
S B = 4.371 + 158.329/T
321.604/T
Ryvlin (1974) was one of the first to
F
F
r 2 = 0.989
express the bulk salinity SB vs. ice floe
20
thickness TF trend empirically. His for-
100
mula takes into consideration the salinity
of the seawater Sw and the ice sheet
growth rate GR as follows:
10
50
SB = Sw (1 - SR ) e a (TF )
0.5
+ SR Sw
(1)
TF = 1.905 + 0.466 GT /1 0.004GT
where SR = SBF/Sw = salinity ratio
r 2 = 0.998
SBF = final bulk salinity at end of
0
0
50
100
150
growth season
T F , Floe Thickness (cm)
a = growth rate coefficient, re-
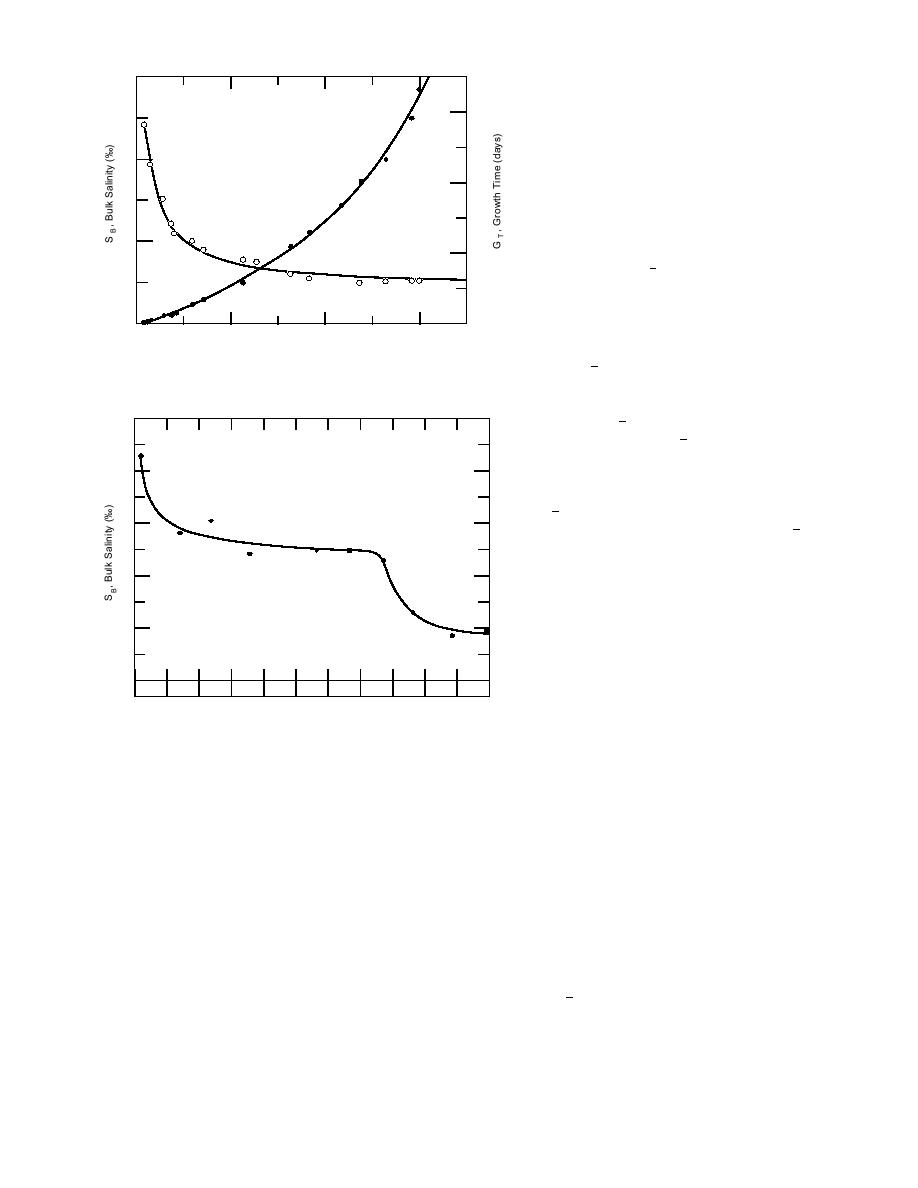
Figure 8. Sea-ice bulk salinity and growth rate vs. floe thickness
ported to vary from 0.35 to
(after Fedotov 1973).
0.5, e.g., at GR ≥ 4 cm/day,
a = 0.35, and at GR ≤ 0.5
10
cm/day, a = 0.60.
Ryvlin suggests that where GR is not
8
known, one may assume the value of 0.5
for a. He also found empirically that SR is ≈
0.13. Using a value of 0.5 and 34‰ for a
6
and Sw respectively, and an unknown value
for SBF, Ryvlin compared eq 1 with his and
Weeks and Anderson's (1958) first-year sea
4
ice SB vs. TF field data, as shown in Figure
10. In this comparison, the agreement be-
tween the empirical estimate and field mea-
2
surements is extremely good throughout
the entire ice floe thickness range. The ques-
0
tion is, does this agreement hold for other
M
A
M
J
J
A
S
O
N
D
J
data sets?
Growth Time
To evaluate Ryvlin's equation, we first
Figure 9. Sea-ice bulk salinity vs. growth time (after Doronin
compiled unpublished first-year Beaufort
and Kheisin 1975).
Sea ice SB vs. TF data that was provided
by Perovich (five cores for TF <25 cm)
The decrease in bulk salinity vs. time shown in
and Kovacs (30 cores), along with published data
Figures 7 and 9 was also observed during lab-
from Gow and Weeks (two cores, 1977), Tucker et
oratory studies of brine entrapment processes
al. (five cores, 1984), and Meese (nine cores, 1989)
in NaCl ice (Cox and Weeks 1975) and in natu-
(Fig. 11). The salinity of the Beaufort Sea near the
ral sea ice by Fukutomi et al. (1951) and Blinov
Alaska coast is 31.5‰. The purpose of using data
(1965).
from just one location is that the salinity of the
These reports clearly indicate that the bulk sa-
water is a parameter that affects ice salinity (Weeks
linity of natural and laboratory-grown saline ice
and Lofgren 1967, Ryvlin 1974). This can be seen
decreases rapidly with increasing thickness or time
in Figure 12, where the only parameter varied in
during the early growth phase, followed by a
eq 1 was the seawater salinity. The fixed param-
second rapid decrease in the bulk salinity during
eters used in eq 1 to create the curves in Figure 12
the early part of the melt season. Because of the
were 0.5 for a and 0.13 for SR. For an end-of-
latter decrease, the bulk salinity data for "warm"
growth-season ice thickness of 200 cm, SB is
or "old" sea ice should not be combined and ana-
4.44‰ and 4.12‰ for an Sw of 34‰ and 31.5‰,
lyzed with "cold" first-year sea ice data.
respectively. For this example, the seawater sa-
6


 Previous Page
