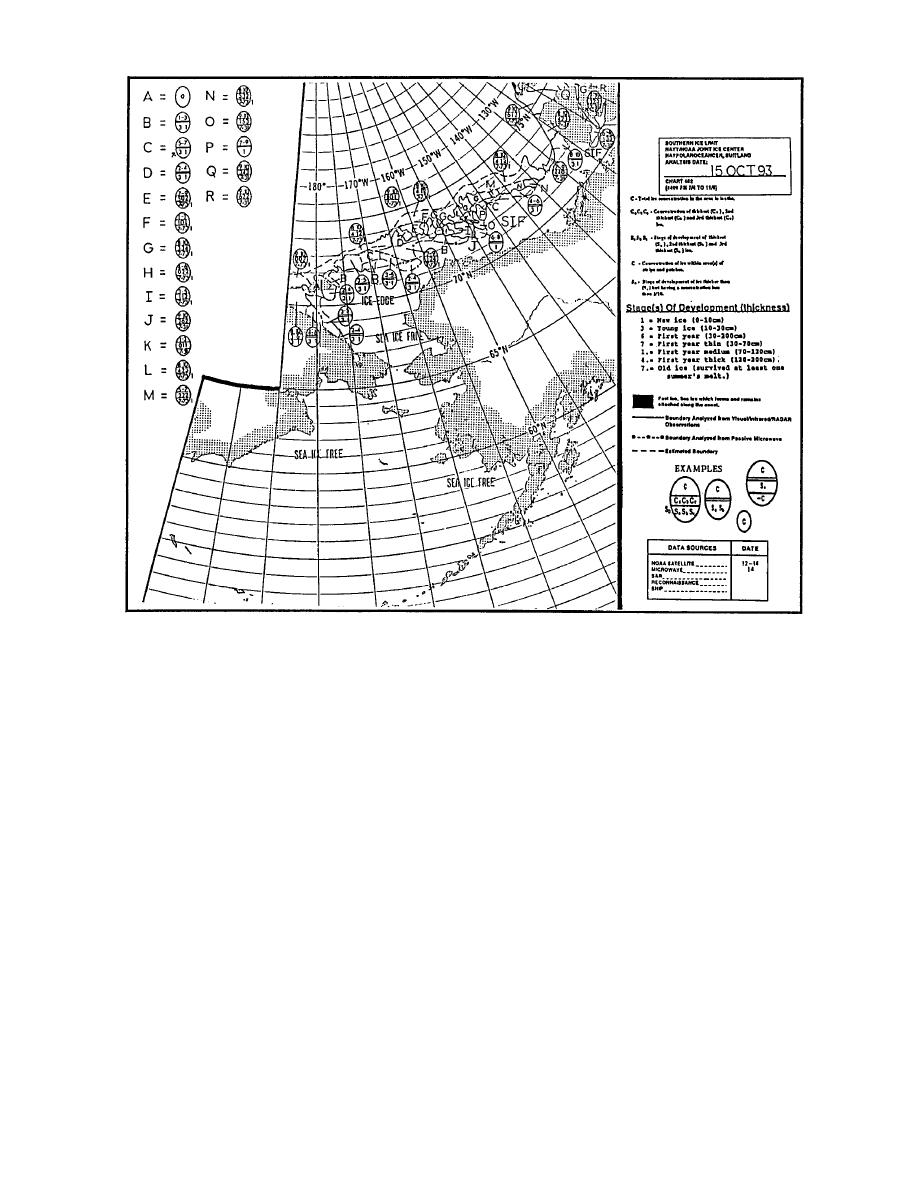
Figure 26. A portion of an Alaskan Regional Ice Analysis from the National Ice Center.
The agency maintains a convenient 24-hour,
L'Astrolabe is described in a report by Johannessen
auto-polling system that subscribers can use to
et al. (1992).
obtain analyses and forecasts in telefaxed form.
The U.S. agency in charge of sea-ice analyses
Figure 26 shows a portion of their Alaskan Re-
and forecasting is the U.S. Navy/NOAA's National
gional Ice Analysis that was produced for 15 Octo-
Ice Center (NIC). It is the world's only organiza-
ber 1993. The NIC can also provide to any U.S.
tion that routinely provides global coverage, and
government agency more specialized guidance
its standard ice guidance products are available to
products, including ship routing recommenda-
the general public. Their data are derived from a
tions, operational briefings, and aerial reconnais-
variety of satellite-borne sensors, and their prod-
sance support. For example, Figure 27 shows a
ucts include:
ship routing recommendation that was transmit-
ted via satellite to the U.S. Coast Guard ship Polar
A weekly, global-scale (1:10,000,000) analy-
Star en route from the Canadian archipelago to
sis showing sea-ice extent, concentration,
Point Barrow, Alaska, in September 1992. NIC pro-
stage of development, and the location of
vided latitude and longitude for each waypoint
leads and polynyas for the entire Arctic
along the track and the distance and heading be-
Basin;
tween each point. The figure shows several large
A biweekly, regional-scale (1:7,500,000) 30-
ice floes that were avoided along the coastal route,
day forecast of the above parameters;
resulting in a significant savings in time and fuel.
A long-range seasonal outlook for the west
A complete description of NIC products and
Arctic, issued each year on 15 May.
39


 Previous Page
