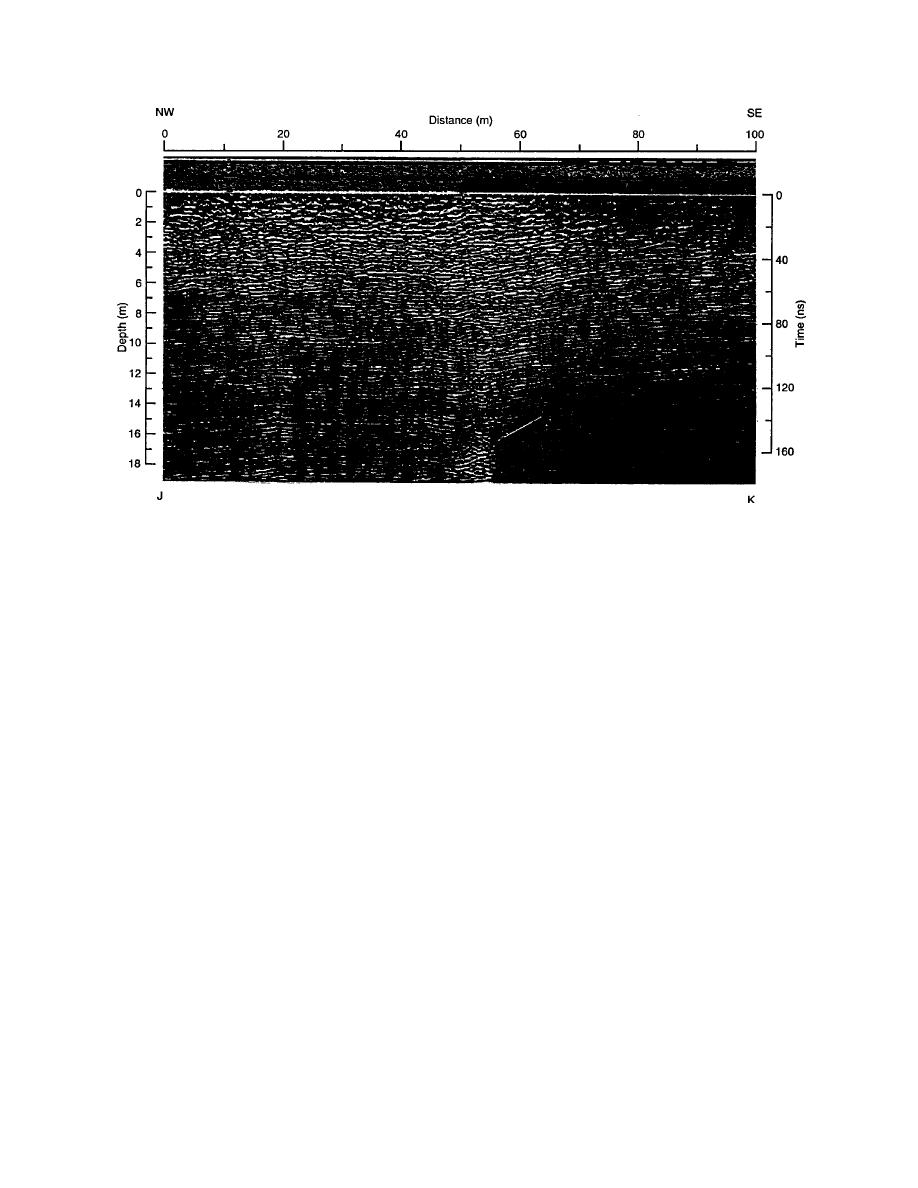
Figure 16. Migration of the profile along the centerline JK at the far sump. A concentration of sewage beginning at
about 14 m depth is apparent, but there is no indication of the lateral spreading reported to exist.
tense. The migration of this record (Fig. 16) picks
m depth. Strong diffractions, apparently from the
utilidor, also occur at point O. Migration of this
up these deeper targets, which probably repre-
profile shows no sewage spread beyond about 10-
sent layers of contaminated snow deeper in the
m radius at point N, considerably less than the 21
sump. The radar records again suggest less lateral
m estimated by M&E.
spread of contamination from the discharge point
Several diffractions occur between the sump
than the 21 m estimated by M&E.
and utilidor that could be leaks along the sewer
An additional profile, 133 m long, was run
line. Although not easily visible in Figure 17, a
from the center of the far sump back to the lift sta-
cluster of weak diffractions between 64 and 80 m
tion (line NO in Fig. 5) to determine if any cavities
are candidates for shafts caused by leaks. The dif-
had been created by leaks along the sewer line
fraction at 30 m depth about 93 m from N may be
that serviced the far sump. Some years ago, a leak
frozen sewage at the base of such a shaft.
along the line servicing sump 2 (see Fig. 5) created
a 1-m-diameter vertical shaft that was about 30 m
deep. A worker clearing snow from the line
Proposed tunnel routes
almost fell into that shaft, which shortly after
ASTRO to main station
became sump 1. Figure 17 shows the time section
The two tunnel routes studied are shown in
of line NO. The time range is 400 ns and the depth
Figure 18. The upper route is divided into sec-
scale is based on nm = 1.60, derived from the deep
tions lettered A, B and C. So much buried debris
diffractions from the sump at point N. This value
was detected within the section A survey (origi-
gives a minimum depth scale because the shallow
nally 30 m wide) just west of the skiway that the
diffractions from buried objects between 25 and
width of that section was increased by 10 m to the
55 m away from the sump (these are too shallow
south and 20 m to the north. Section D in Figure
to be leaks) give nm = 1.30. The profile has been
18 is a narrow swath surveyed between the
horizontally filtered to remove most of the re-
sponse to the firn layering and is presented in a
ASTRO facility and the elevated dormitory. All
signal intensity format so that diffractions can be
surveys consisted of parallel profiles, about 2.8 m
viewed more easily. As in profile JK of Figure 15,
apart, running the length of the sections. The pro-
there are strong diffractions beginning at the cen-
files are alphabetically lettered and may be locat-
ter of the sewage sump (point N) at about 15 to 30
ed later in Figures 21 and 22.
17


 Previous Page
