well. Prior CRREL and M&E measurements have
asymptotes are highly visible, a consequence of
shown the depth to contamination at the center of
the off-axis strengthening of antenna directivity
sump 2 to be approximately 12 m. Sump 2 is prob-
shown in Figure 2.
ably similar to the depiction in Figure 11, with a
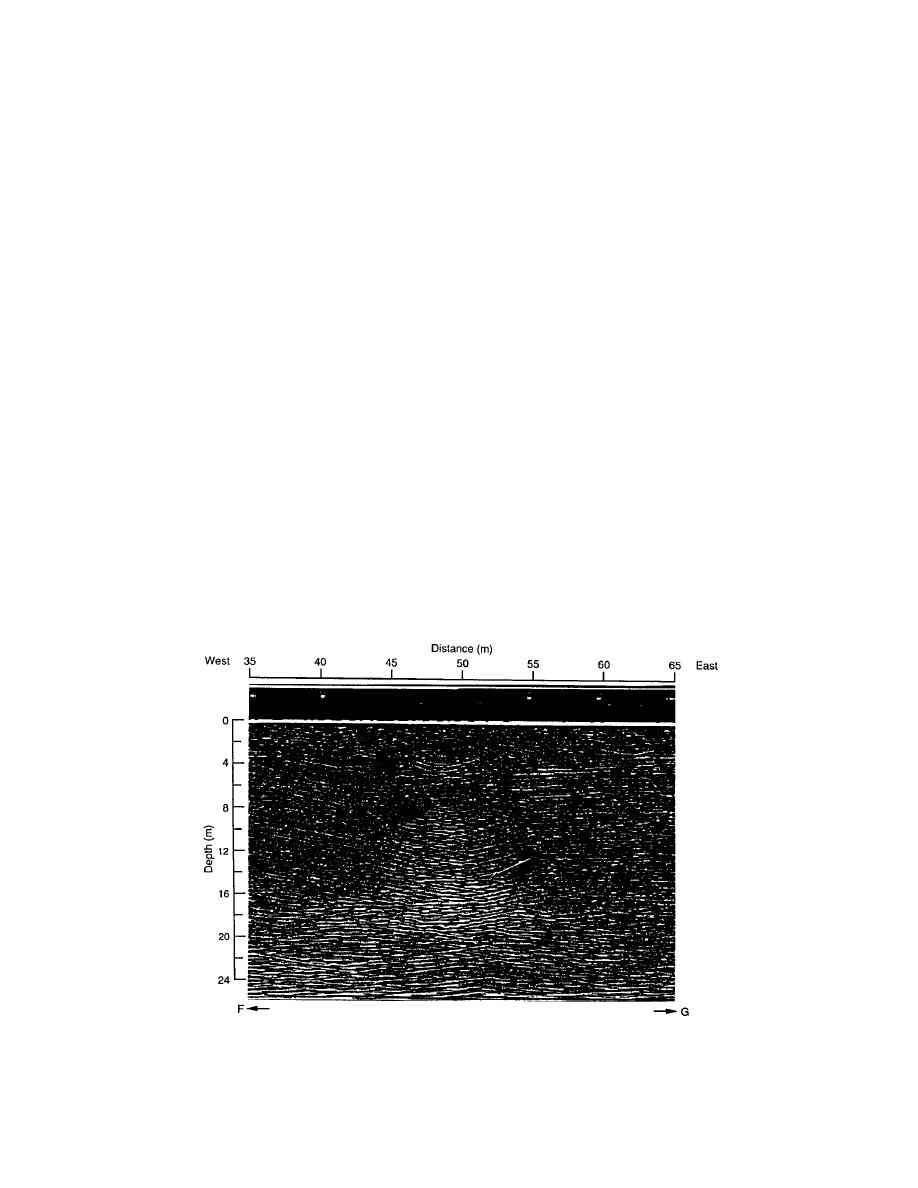
The top profile of Figure 13 equalizes the gain
throughout the record so that all events are equal-
radial extent of about 21 m and a maximum depth
ly apparent, especially those from the density con-
of about 35 m. However, since this sump has not
trast interfaces, which appear to subside toward
received warm sewage for some time, no liquid
the sump. This subsidence is consistent with
exists within it.
known increases in snow consolidation from
The 400-MHz time section profile over sump 2
warming in the vicinity of such sumps. Snow con-
between points F and G is shown in two versions
solidation is also apparent from the refractive indi-
in Figure 13. All of the hyperbolic diffractions in
ces measured at sumps 1 and 2; the values of 1.5 to
the profile can be matched well using a refractive
1.6 over the 16-m depth are higher than maximum
index of about 1.54. We used this value to calibrate
values (1.4) found over similar depths along the
the depth scale, and it corresponds to an average
snow density of about 0.65 g/cm3. The signal in-
tunnel survey.
A migration of the central section of this profile
tensities within the bottom profile are approxi-
is shown in Figure 14. Some of the peak signal
mately proportional to the actual reflectivity
strengths along the profile scans are amplified to
throughout the sump because signal loss with
bit saturation to allow us to view the deeper re-
range is compensated for by the radar system
turns. The migration shows a coherent horizon at
Time-Range-Gain (TRG) function. Several closely
about 14 m depth and then reflections that spread
spaced diffractions, originating over the center of
asymmetrically to an approximate width (diam-
the sump area, begin at an apparent depth of 4 m
eter) of 25 m at a depth of about 16 m. The sump 2
and continue throughout the depth of the record.
region seems to extend about 15 m to the west, but
Within these diffractions lies the stronger respons-
this sump is known to be refrozen and to extend
es to the frozen sewage at just over 12 m depth.
radially about 20 m towards the water well. There-
The many diffractions that originate below 12 m
fore, we conclude that the contaminated firn
are probably from deeper portions of the sump,
beyond a 15 m radius did not produce detectable
which is expected to extend to a depth of about 35
reflections.
m. These diffractions are so strong that their
Figure 14. Migration of the central section of the sump 2 profile using a migration veloc-
ity based on nm = 1.54 (density 0.65). The section indicates that the sewage spreads to an
estimated width (diameter) of 25 m, 15 m of which is towards the water well. Arrow points to
a coherent reflection at about 14 m depth.
15


 Previous Page
