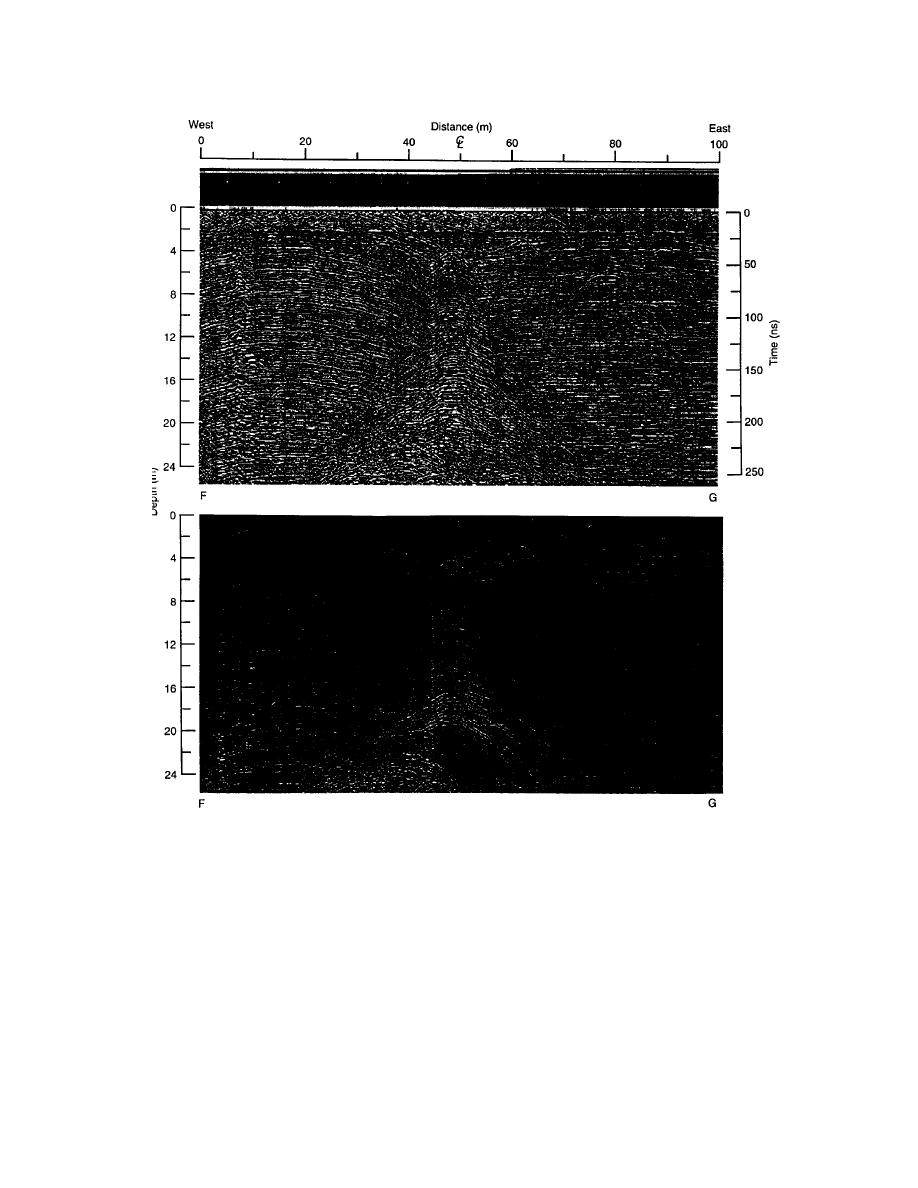
Figure 13. Two versions of the 400-MHz profile recorded at 300 ns across line FG over sump 2. The sump is
centered at the 50-m distance. The bottom profile represents an estimate of the actual reflective strength throughout
the sump and shows greater diffraction intensity below 12 m where frozen sewage begins. The later diffractions are
strong enough to make their asymptotes visible. The top profile equalizes the intensity of all events and reveals the
density horizons that subside toward the sump.
13.4 m toward point O and could have raised the
ble without better knowledge of our exact antenna
level of the contamination in this area. We believe
location, near-surface snow density structure and
that the response to this sewage is event C in Fig-
any debris or other structures that may exist above
ure 12b. The radar data migration suggests that the
the roof.
radius of the sump below the end of the utilidor is
The depth to contamination at the sump below
about 5 m, but we expect that it is much larger.
the utilidor vent had to be 9 m or less, since some
Sump 2 was traversed from west to east along
time ago that sump had filled to the level of the
line FG (Fig. 5). The center of the sump 2 area is
floor of the utilidor. The depth could even be less,
approximately 70 m from the center of the water
since sewage was discharged up the utilidor about
14


 Previous Page
