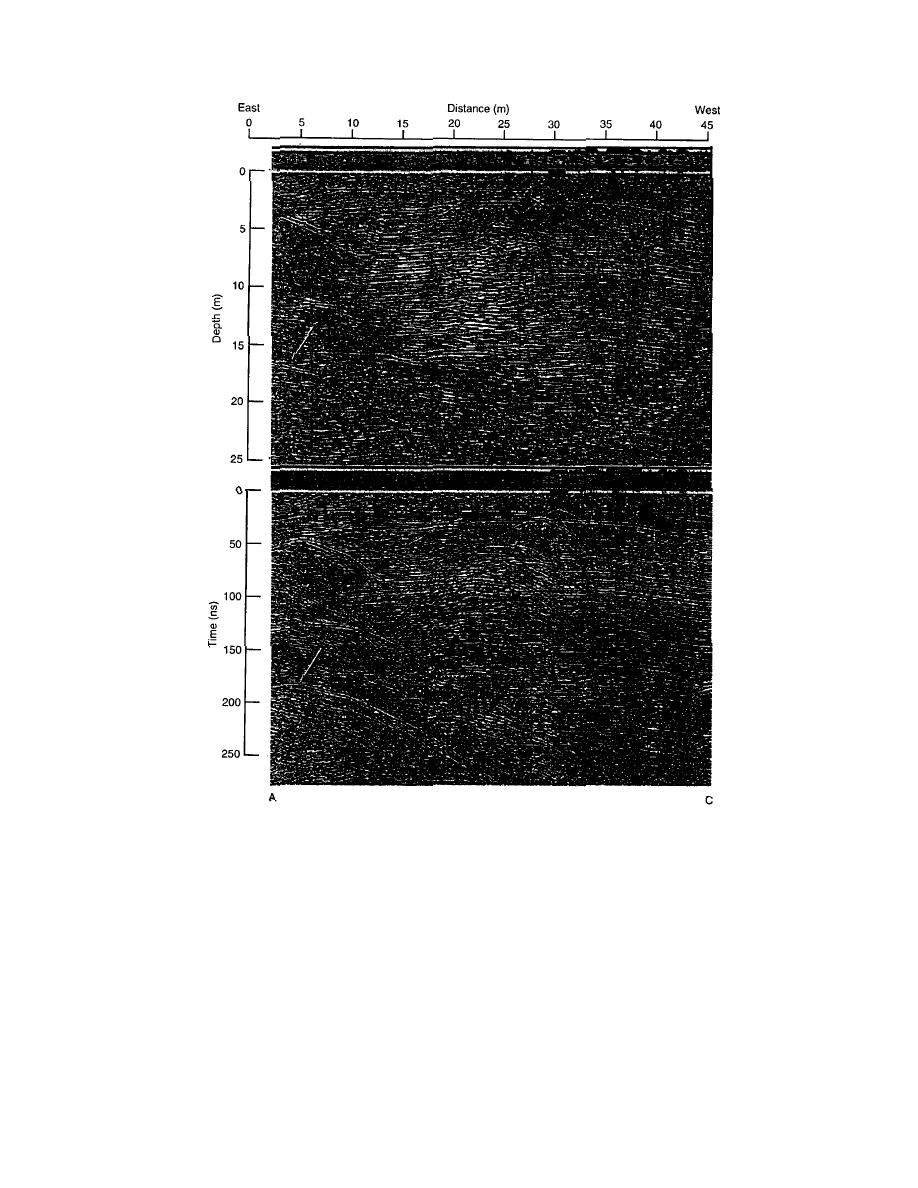
a. Line AC, which runs west from the sump 1 area. Arrows point to the response of
the sump at a depth of about 17 m.
Figure 12. 400-MHz time-section profiles (bottom) and their migrations.
less than the 21 m expected on the basis of penetra-
The area marked sump 1 was profiled along
tion rate measurements of holes melted with an
two lines (AB and AC) as shown in Figure 5. These
electric heater some time ago.
profiles along with their migrations are shown in
The time section profile in Figure 12b (bottom)
Figure 12. The migration used a value nm = 1.55,
along line AB starts at the center of sump 1 and
obtained from the sump 1 diffractions, to calibrate
passes near the utilidor vent at about 29 m and
depth. The time section in Figure 12a (bottom)
over the sewage sump centered about there. As
along line AC shows the diffraction response of
shown in Figure 12a, the sump 1 response (arrow
the sump (arrow) to originate at an approximate
A) occurs at a depth of about 17 m and seems to
depth of 17 m. The migration of this profile (Fig.
extend only about 7 or 8 m northward. The diffrac-
12a, top) shows the sump response to extend only
tion response, which we believe is the utilidor roof
about 7 m in the westerly direction, considerably
12


 Previous Page
