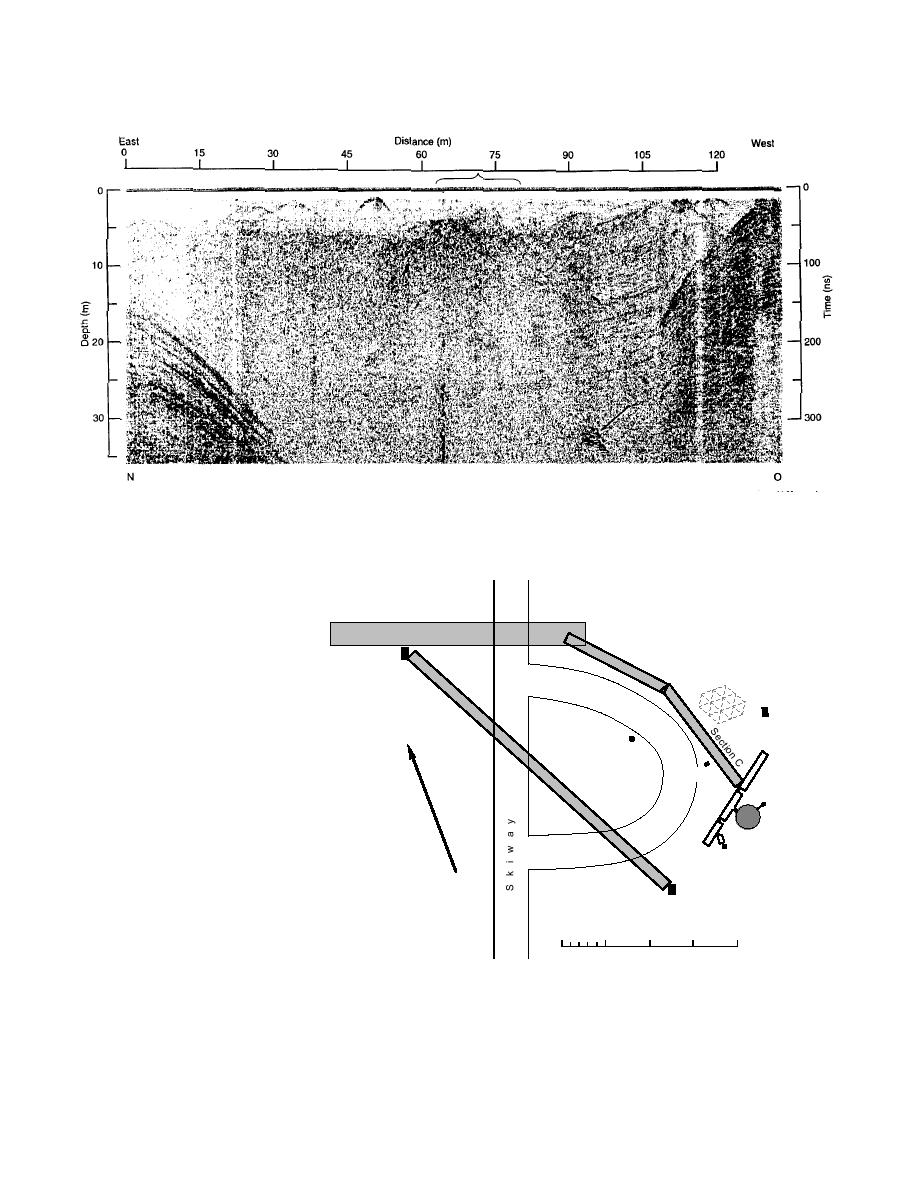
Figure 17. 400-MHz time-section profile from the center of the far sump (point N) back toward the lift station. The diffractions
beginning at about 15 m depth at point N are responses to the frozen sewage, but there is no indication of the lateral spreading
previously reported because all these diffractions originate near point N. The bracket spans a cluster of weak diffractions whose depth
indicates that they may be an old sewer leak, and the arrow points to a deep anomaly of unknown origin.
The profiles of lines D
and G within section A are
Section A
shown in Figure 19. The
accuracy of the distance scale
Se
ctio
depended on accurate elec-
nB
tronic marker recording at
Spase
Array
the moment of passing the
flagged stations. This became
CAF
Grid North
progressively more difficult
(Greenwich Meridian)
Geographic
as the lines moved farther
South Pole
Fuel
from the flags and so dis-
Fuel
Se
Arcch
Arh
Bladder
tance accuracy is probably 2
ct
io
n
D
m at best. The depth scale is
Skylab
calculated from the value of
nm = 1.4, which is the maxi-
Dome
mum found from diffractions
Taxiway
within the firn. Therefore,
Elevated
this value gives the mini-
Dorm
mum possible depth to the
objects (apexes of the diffrac-
0
100
200
300
400 m
tions). The profiles are pre-
sented in a signal intensity
format that emphasizes only
the stronger events. Both profiles show a heavy
Figure 18. Proposed tunnel routes. Sections A, B and
concentration of diffractions just west of the ski-
C run from the dome to the ASTRO and CARA (under
way. This concentration is characteristic of most
construction) astronomical facilities. Section D is a 10-
profiles in this section and is the most formidable
m wide section that extended 800 m from the ASTRO
building to the elevated dormitory across the skiway.
obstacle in the tunnel survey. Further to the west
18


 Previous Page
