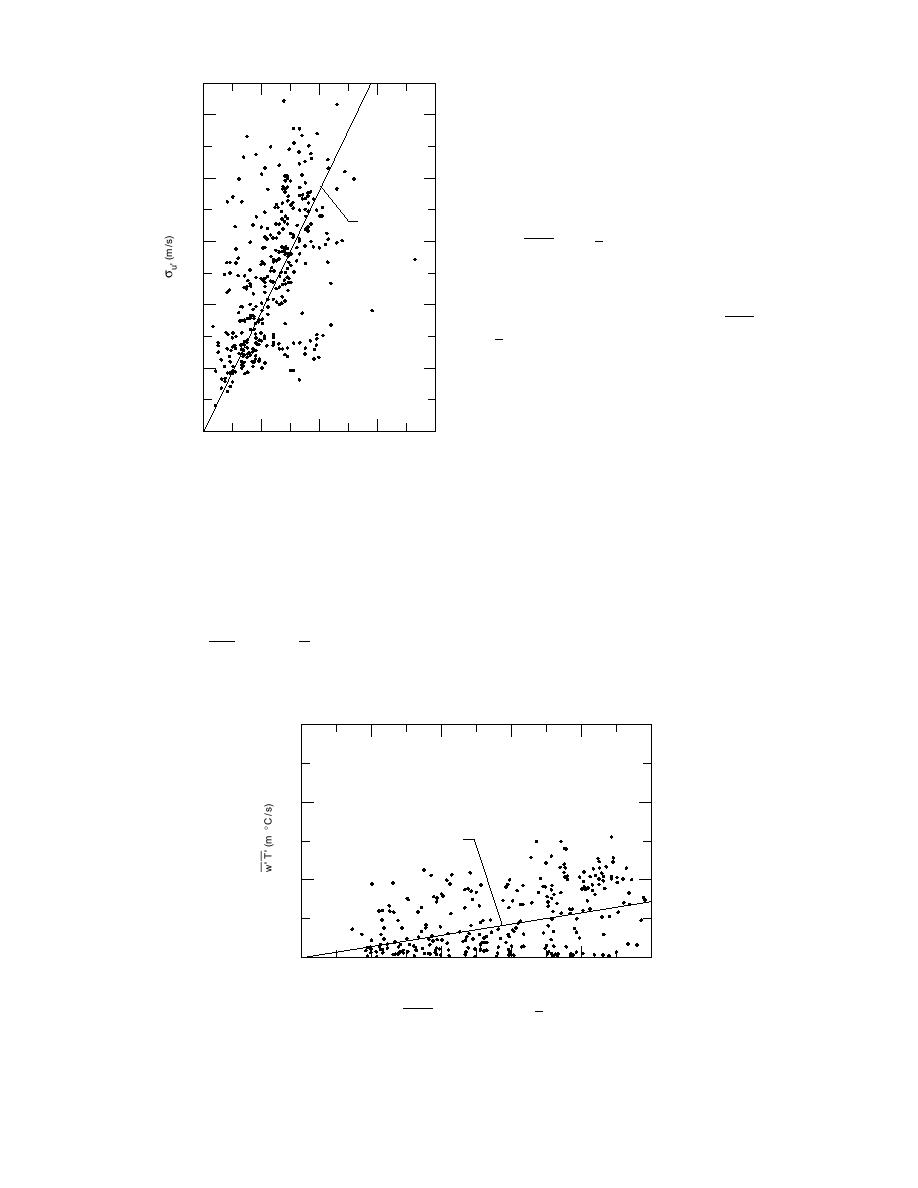
Tests under stable conditions were hard to
realize. A stable surface air layer with very calm
2.0
winds usually prevails soon after sunset. How-
ever, the magnitude of the sensible heat flux
under stable conditions is very low, and the few
1.6
data points collected during this period exhibit-
ed a much greater dispersion than in the case of
σu' = 3.78 u*
unstable conditions. Figure 14 shows the rela-
tion of - w′ T ′ with u2m (we consider the heat
1.2
flux from the air to the snow or ground surface
to be negative). The least-squares analysis only
gives a correlation coefficient of 0.0751, indi-
0.8
cating practically no correlation between - w′ T ′
and u2m .
The ratio of σw′ /u* may be expressed in terms
0.4
of a universal function of the stability parameter
z/L according to the similarity theory. Figure 15
shows the variation of σw′ /u* with z/L, clearly
0
exhibiting the features of the ratio varying over
0
0.2
0.4
0.6
0.8
a range of z/L from 100 ≤ z/L ≤ 100 (in most of
u (m /s)
*
the past studies, the range of z/L is from 1 ≤ z/L
Figure 12. Standard deviation σu′ as a func-
≤ 10). As in other studies, there is a great disper-
tion of u* based on data taken in late fall,
sion of data (all the overlapping values of σw′ /
winter, and early spring.
u* are omitted in the figure). No values of σw′ /
u* fall into the range of 0.01 < z/L < 0.01 due to lack of near-neutral conditions. For unstable
conditions over the whole range of z/L covered in this study, the value of σw′ /u* can be fairly
represented by
1/ 3
σw′
z
= 1.3 1 -
,
(77)
L
u*
0.3
0.2
_
--
-- T' = 0.014 u 2m
w'
0.1
0
0
1
2
3
4
5
u
_ 2m (m / s)
Figure 13. Covariance w′ T′ as a function of u2m during late fall,
winter, and early spring.
29


 Previous Page
