at the center with four (3-component) sonic anemometers and resistance thermometers installed at
1.6, 4.3, 12.3, and 29.5 m above the ground. The booms for the sonic anemometers and the
resistance thermometers extended 2.0 m southeast and northeast, respectively.
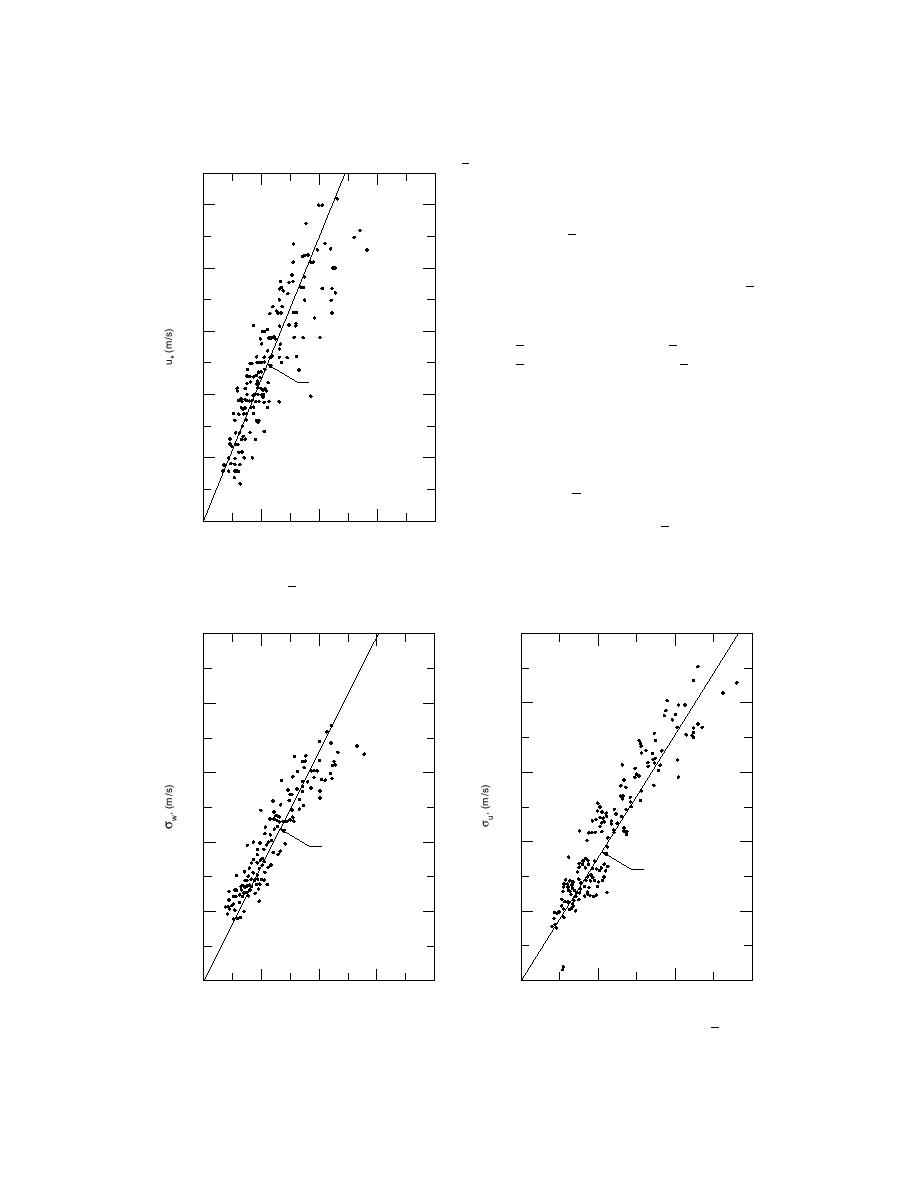
Figure 4 shows the relation between u* and
u2m . For six sets of data taken during the months
of June and July 1991, a simple linear relation-
ship can be expressed as
0.5
u* = 0.113 u2m ,
(65)
0.4
which is found to be identical to the average rela-
tionship developed by Kai (1982), i.e., u* = 0.11u
(in Kai's test there are four sonic anemometers,
so there is one linear relation for each level:
0.3
u* = 0.10 u a t 1 . 6 m , u* = 0.12 u a t 4 . 3 m ,
u* = 0.12 u at 12.3 m, and u* = 0.09 u at 29.5 m.
u = 0.113 _ 2m
u
Figure 5a shows the standard deviation σw′ ,
*
0.2
representing the turbulent fluctuation in the verti-
cal direction, as a function of the mean wind
speed. As in Figure 4, the relationship can be
0.1
linearly represented by
σw′ = 0.16 u2m .
(66)
0
It shows that σw′ increases with u2m . It was sur-
0
2
4
6
8
_ 2m (m /s)
u
prising to note that an identical relation was de-
veloped by Kai (1982) from test results gathered
from a much more homogeneous field (i.e.,
mean wind speed at u2m .
2.0
1.0
1.6
0.8
1.2
0.6
σw' = 0.16 _ 2m
0.8
0.4
u
σu' = 0.35 _ 2m
u
0.4
0.2
a.
b.
0
0
0
2
4
6
0
2
4
6
8
u
_ 2m (m /s)
u
2m (m /s)
Figure 5. Standard deviations σ w′ (a) and σ u′ (b) as a function of mean wind speed at u2m .
24


 Previous Page
