8
1.6
8
1.6
_
_
12_19_91(_________
_ / __/ __ over snow)
12_19_91(_____l__f______)
_ / __/ __ over f uf y snow
σu'
σu'
σw'
σw'
u 2m
u 2m
1.2
6
1.2
6
0.8
4
0.8
4
2
0.4
2
0.4
a.
b.
0
0
0
0
10
12
14
16
10
12
14
16
Time (hr)
Time (hr)
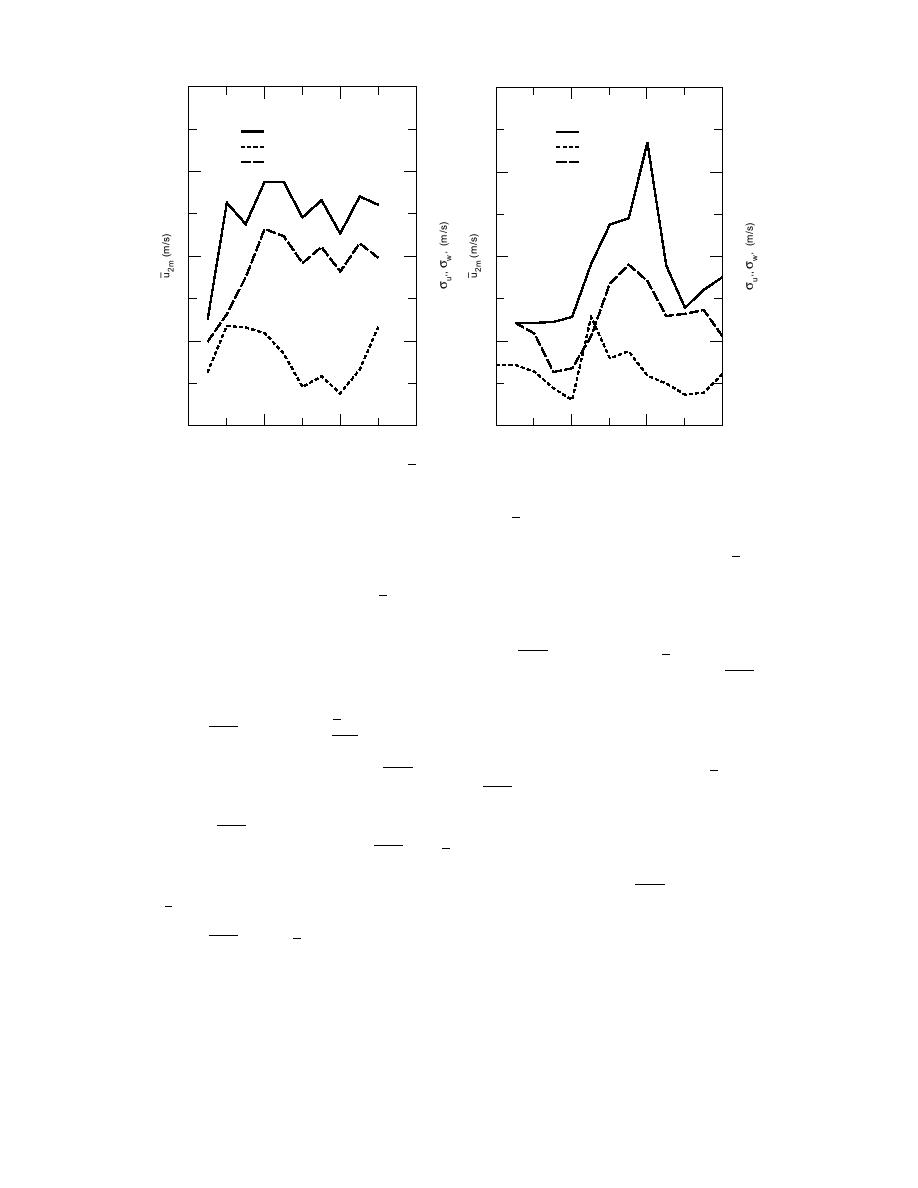
Figure 7. Variation of σ u′ , σ w′ and u2m with time (a) over snow and (b) over fluffy snow.
Figures 7a and 7b respectively show the variation of u2m , σ u′ , and σw′ as functions of time
over snow with different structures. There seemed to be no one-to-one correspondence between the
turbulence intensity of σ u′ and σw′ , i.e., when σ u′ is at maximum σw′ is not. The variation of u2m
does resemble σ u′ more than σw′ . It can be noted that in both cases the peak value of σw′ was
reached before the highest value of u2m occurred. This phenomenon may be attributed to the rapid
warming of the surface air layer and its subsequent rising, which introduces added upward natural
Figure 8 shows the relation between the covariance w′ T ′ and the ratio of u2m / u , which
*
covered eight sets of data taken over a field of grass that was about 3 cm high. The covariance w′ T ′
can be fairly represented by
u
w′ T ′ = 0.212 - 0.013 2m .
(70)
u*
It indicates that as u2m/u* increases, w′ T ′ decreases. In other words, for the same value of u2m but
with u* increasing, there will be larger values of w′ T ′ . The larger the value of u*, the more
momentum transfer there is. For a value of u2m/u* equal to ~16.3, if the above relation holds, the
value of w′ T ′ approaches zero.
Figure 9 shows the variation of w′ T ′ with u2m . This figure covers the period from May to July
1991 and consists of nine sets of data. Though the graph shows a greater scatter (which is not
unusual for micrometeorological measurements), there is a concrete trend that w′ T ′ increases with
u2m and can be fairly represented by
w′ T ′ = 0.042 u2m .
(71)
The lines shown in Figures 4 through 6, 8, and 9 are drawn by visual observation.
The following sets of figures are based on data taken during the late autumn, winter, and early
spring of 1992 (in all 11 sets of data). During these periods, the ground was either covered with
snow or ice, or it was bare but either partially frozen or frozen. Figure 10 shows the relation
26


 Previous Page
