0.20
0.16
0.12
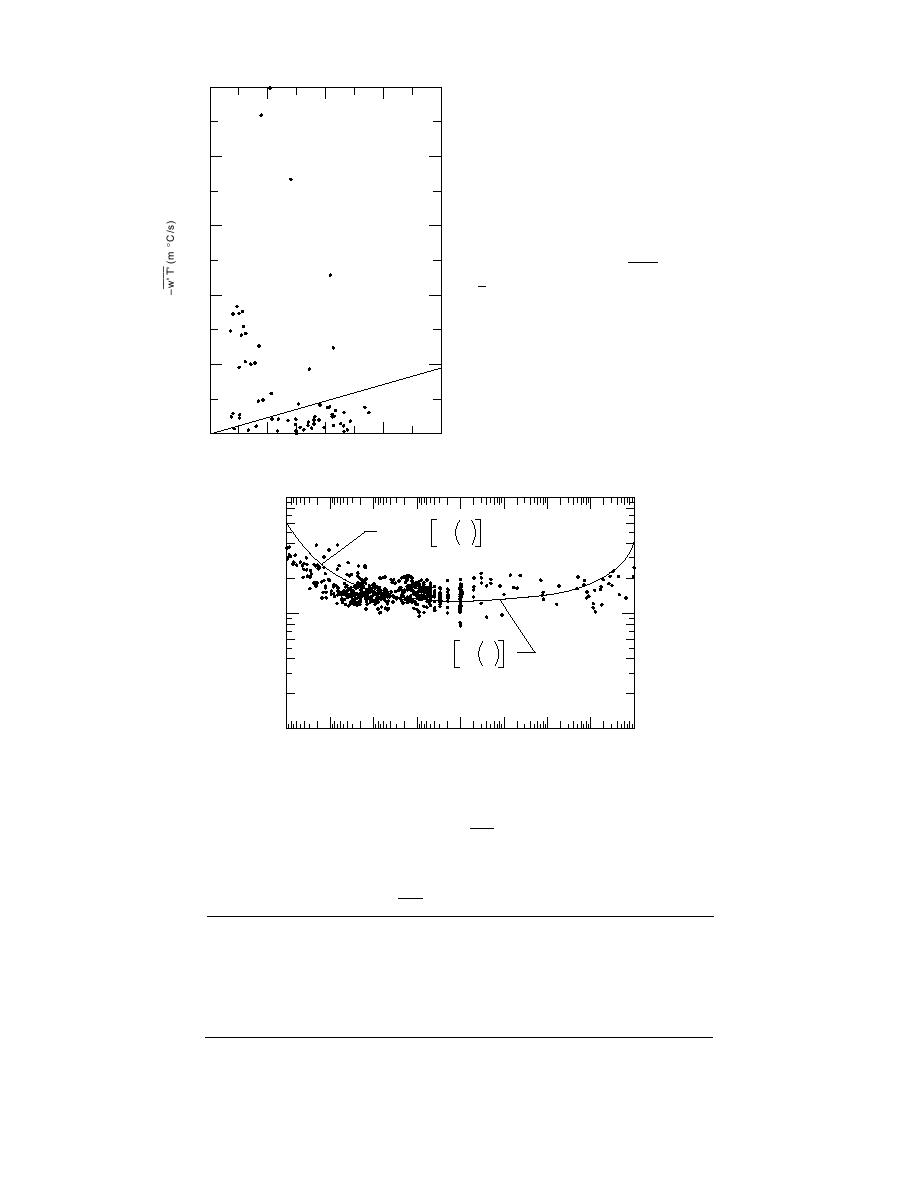
Figure 14. Covariance - w′ T′ as a function of
u2m during late fall, winter, and early spring.
0.08
0.04
0
0
2
4
6
8
u 2m (m / s)
_
10
1
σw'
z
3
= 1.3 1
u
L
*
σ w'
u 1
*
1
σw'
z
4
= 1.3 1 +
u
L
*
0.1
0.01
100
10
1
0.1
0.1
1
10
100
z/L
Figure 15. Variation of σw′ /u* with stability parameter z/L.
σw′
Table 3. Comparison of the ratio
under neutral conditions.
u
*
Height of
measurement
σw′
Test field
(m)
References
u*
Over the sea
1.23
6.4, 12.5
Natio (1978)
Over the sea
1.32
8
Pond et al. (1971)
Over the sea
1.47
1.4--4.5
Miyake et al. (1970)
Over land
1.53
1.4
McBean (1970)
Over tall grass
1.32
1.6, 4.3, 12.3, 29.5
Kai (1982)
Over snow, frozen ground,
1.30
2
This study
and partially frozen ground
30


 Previous Page
