ε = 0.4
1.6
φ=0
1.4
S T = 0.68
0.40
1.2
0.30
0.23
1.0
0.20
0.15
0.8
0.10
0.08
0.04
0.6
0.02
0.01
0.4
10 0
10 1
10 2
10 3
10 4
τ
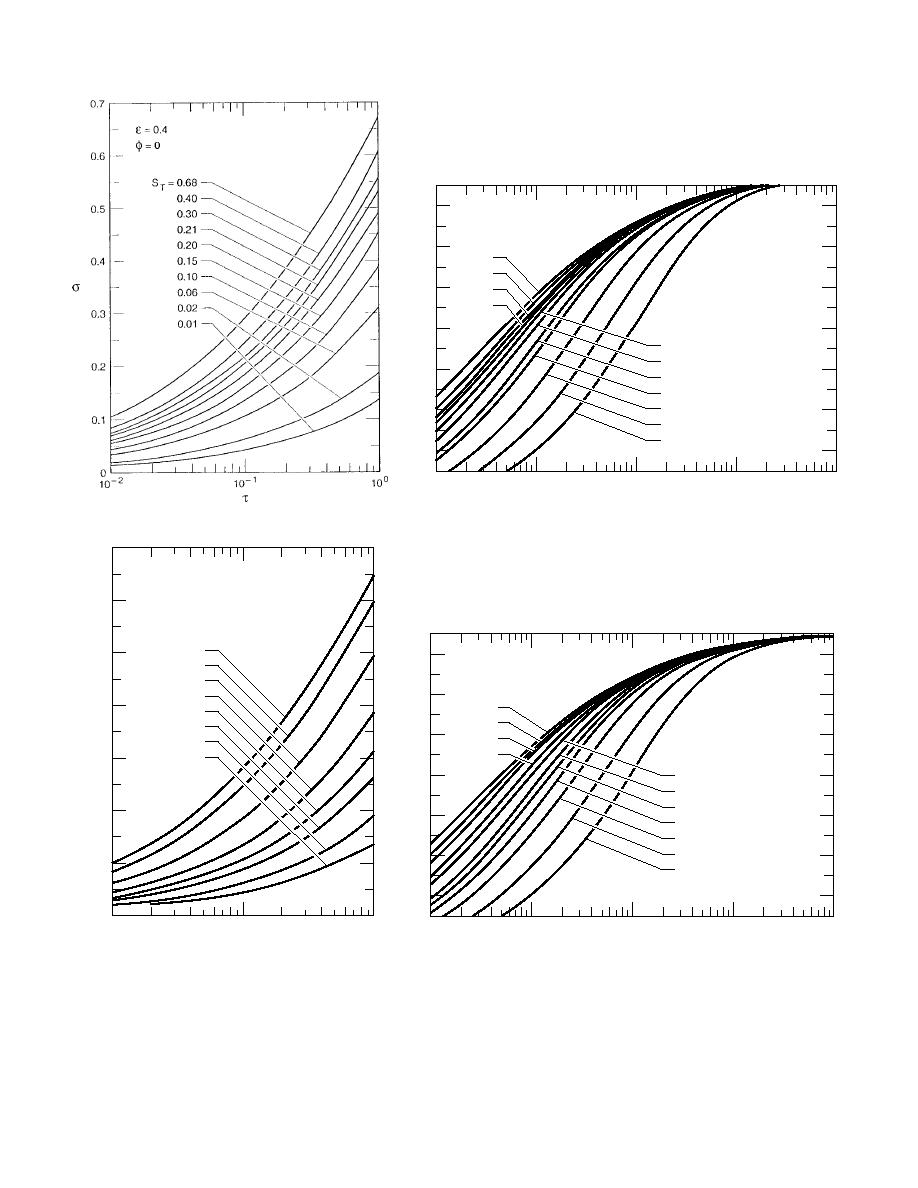
Figure 15. Formation time of permafrost, saturated mineral soils, φ = 0, ε = 0.4.
0.7
ε = 0.379
φ=0
0.6
S T = 0.60
0.5
1.6
ε = 0.379
0.40
φ=0
0.20
1.4
0.10
0.4
S T = 0.60
0.06
0.40
σ
0.04
1.2
0.30
0.02
0.20
0.01
0.3
1.0
0.15
0.10
0.08
0.2
0.8
0.06
0.04
0.02
0.6
0.1
0.01
0.4
0
10 2
10 1
10 0
10 0
10 1
10 2
10 3
10 4
τ
τ
Figure 16. Formation time of permafrost, saturated mineral soils, φ = 0, ε = 0.379 (Prudhoe Bay, Alaska).
plots the time needed to reach 90% of the equilibrium permafrost thickness at a site. Figure 19 shows the
thickness of permafrost formed after 15,000 years as a function of average surface temperature for different
soils as characterized by the soil porosity. Figures 20 and 21 show that syngenetic growth greatly reduces
the formation time during the latter stages of permafrost growth. However, there may be significant ques-
tions as to whether surface deposition has continued for long periods of time at any given location.
15


 Previous Page
