ψ = 0.02
1.6
0.005
0
0.01
1.4
1.2
σ
1.0
0.8
Syngenetic Growth
S T = 0.15
0.6
ε = 0.379
φ=0
0.4
1
10
100
1000
τ
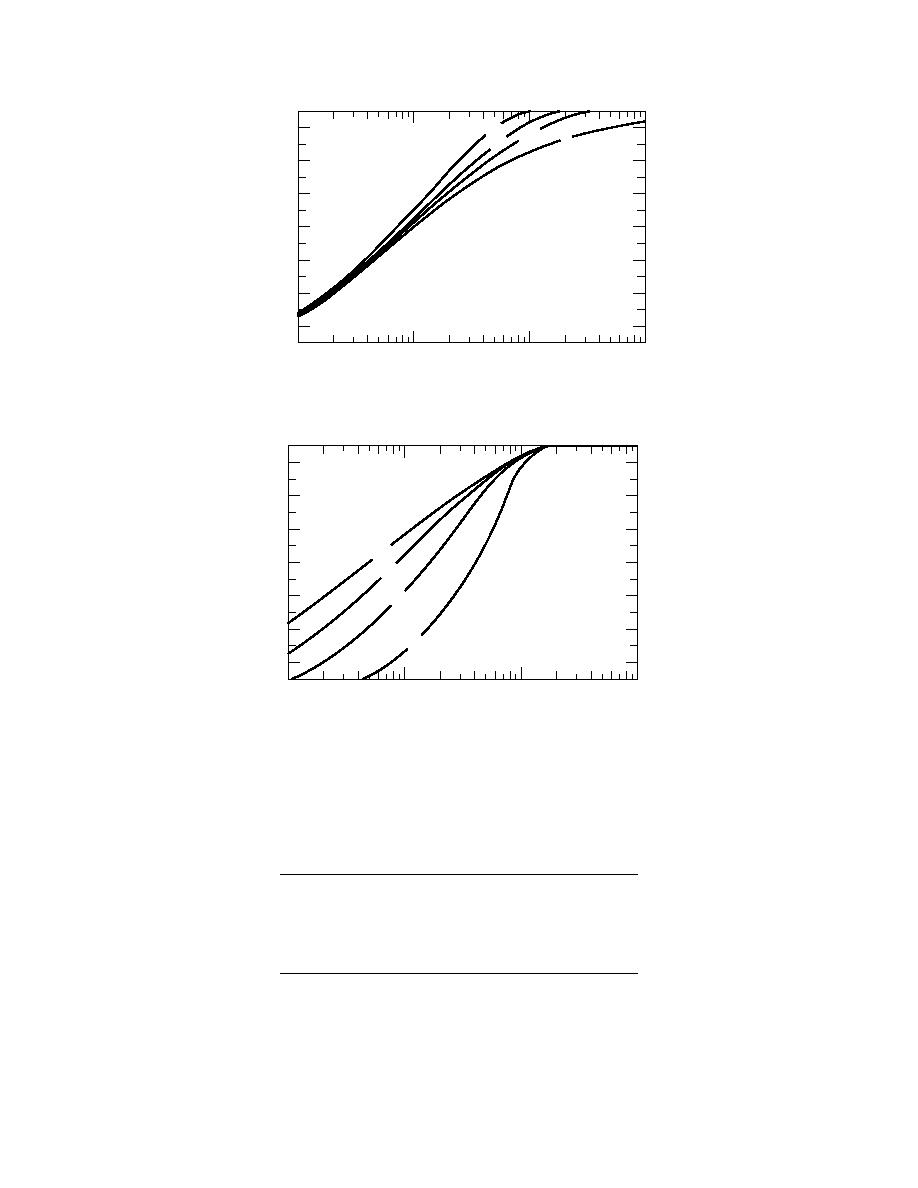
Figure 20. Syngenetic growth of permafrost, saturated mineral
soils, φ = 0, ε = 0.379, ST = 0.15 (Prudhoe Bay, Alaska).
1.6
1.4
1.2
S T = 0.50
1.0
0.15
0.8
0.05
Syngenetic Growth
ψ = 0.01
0.6
ε = 0.379
0.01
φ=0
0.4
1
10
100
1000
τ
Figure 21. Syngenetic growth of permafrost, saturated mineral
soils, φ = 0, ε = 0.379, ψ = 0.01 (Prudhoe Bay, Alaska).
Table 3. Paleotemperature scenarios, Prudhoe Bay, Alaska
(after Osterkamp and Gosink 1991).
Duration before
present time
Stefan
Ts*
(C)
Scenario
(years)
number
Present (Lachenbruch et al. 1982)
10.99 10,00015,000
0.1438
Brigham and Miller (1983)
13.69
240,000
0.1827
Matteucci (1989)
11
300,000
0.1440
Vostok, Robin (1983)†
16
160,000
0.2159
E. Siberia (Maximova and
Romanovsky 1988)†
11.3
170,000
0.1483
* Average value of the fluctuating surface temperature over the indicated
time span.
† Fitted to present Prudhoe Bay surface temperature.
17


 Previous Page
