Neumann solution
The Neumann solution is a special case that occurs when the initial temperature gradient G is zero.
Thus, it is the conduction solution that will predict the minimum time needed to form a given thickness of
frozen material. The exact solution is well known as
X = 2γ N α1t .
(19)
γN is a function of ST , φ and the property ratios and is known (Lunardini 1981). Equation 19 can also be
written as
σ N = 2γ N τ .
(20)
Steady-state solution
Unlike the Neumann solution, the permafrost zone for the general case with a non-zero geothermal gra-
dient reaches an equilibrium value. The equilibrium value is the thickness of permafrost that will form if in-
finite time is available for growth. At steady state, the net heat flux at the phase change interface will be
zero so that (dX/dt)∞ = 0. Then the temperature in region 1 is
∆T1x
T1∞ =
+ Ts .
(21)
X∞
At the solidification interface
T1∞
= k2G .
(22)
k1
x
Thus
∆T1
X∞ =
(23)
k21G
or
1
σ∞ =
.
(24)
k21
Effect of quaternary freezethaw cycles
The previous discussion assumed that the soil was initially unfrozen, with a temperature distribution giv-
en by eq 2c, as shown in Figure 9. However, the cyclic warming and cooling that has taken place over the
past million years will tend to cyclically lower the ground temperature as compared to the previous initial
temperature distribution. If the temperature is lower than that of eq 2c, the permafrost growth will be accel-
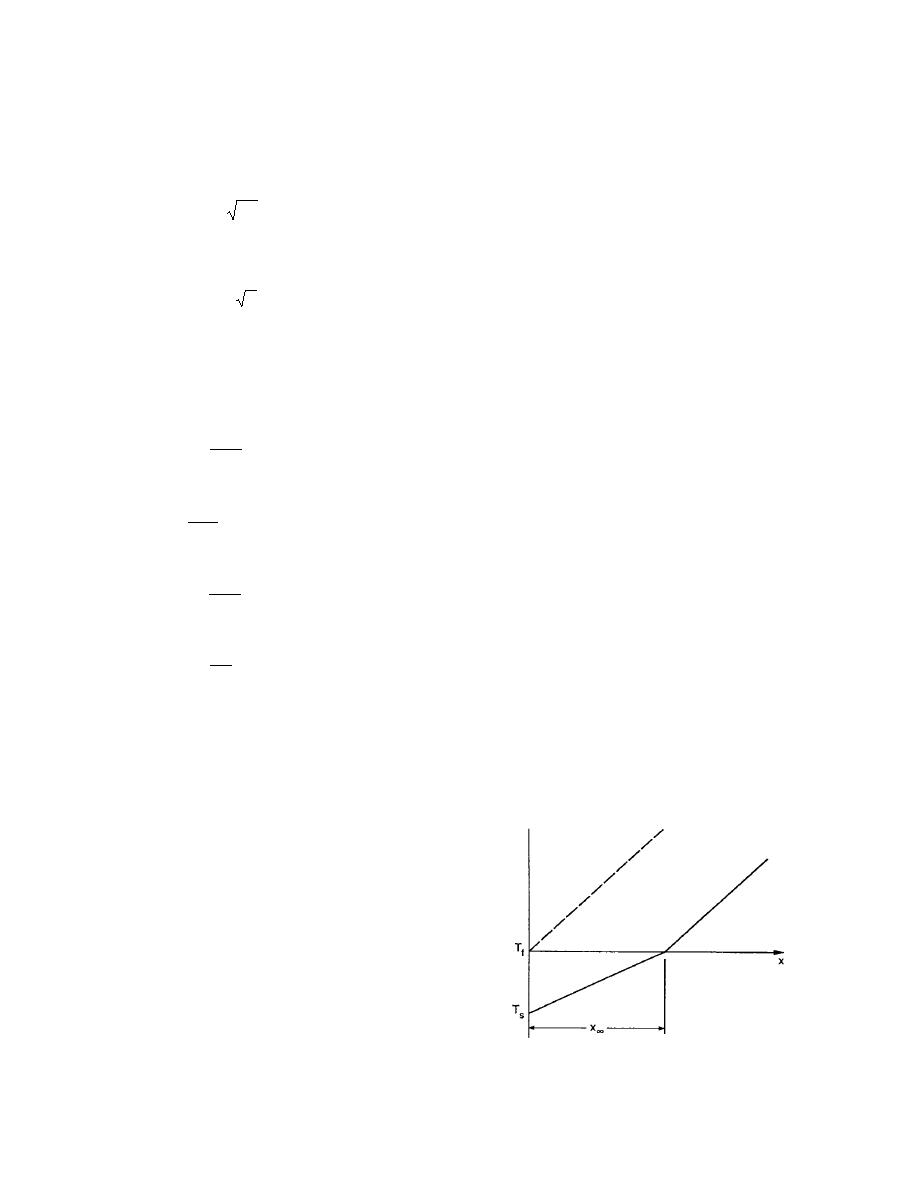
erated. Figure 10 shows the thermal state of permafrost at equilibrium with a geothermal heat flow--the
solid line. The approach to the equilibrium state of the per-
mafrost is affected by the initial temperature of the soil in
that the time to reach equilibrium will be greatly changed
but the final equilibrium thickness is not affected by the
initial assumption (see eq 23).
Let us assume that surface warming to Tf occurs and
the permafrost eventually reaches a stage where the entire
frozen zone is at Tf . The system starts to thaw in this con-
dition and we ignore the time needed to reach this state
(small compared to melt time scales) and also neglect the
bottom freezethaw during this initial warming time. Fig-
ure 11 shows the thermal state as the bottom thaw com-
mences, at x = Xo. The geothermal heat flow is used to
Figure 10. Temperature distribution after
melt permafrost and also to warm the soil in the region X
initial freeze of soil.
11


 Previous Page
