balance changes in the Southern Ocean. These are the National Ice Center weekly ice charts and
a collection of over 20,000 in situ ship-based ice observations. A recent study comparing
thickness estimates obtained using NIC ice charts to ship-based observations within the Ross Sea
sector showed a correlation between satellite-derived and in situ estimates (Schellenberg 2002).
These preliminary findings suggest potential usefulness of the NIC data to develop a continental-
scale sea-ice climatology. This paper reports on our sea-ice comparison from conditions during
two contrasting years, 1995 and 1998. Specifically we report on the development of the spatial-
temporal database to compare the NIC ice charts with the ship-based observations, and the tools
used to analyze the sea-ice extent and thickness. Problems encountered in using ArcGIS in the
southern polar region along with our solutions will be discussed in our presentation.
Data
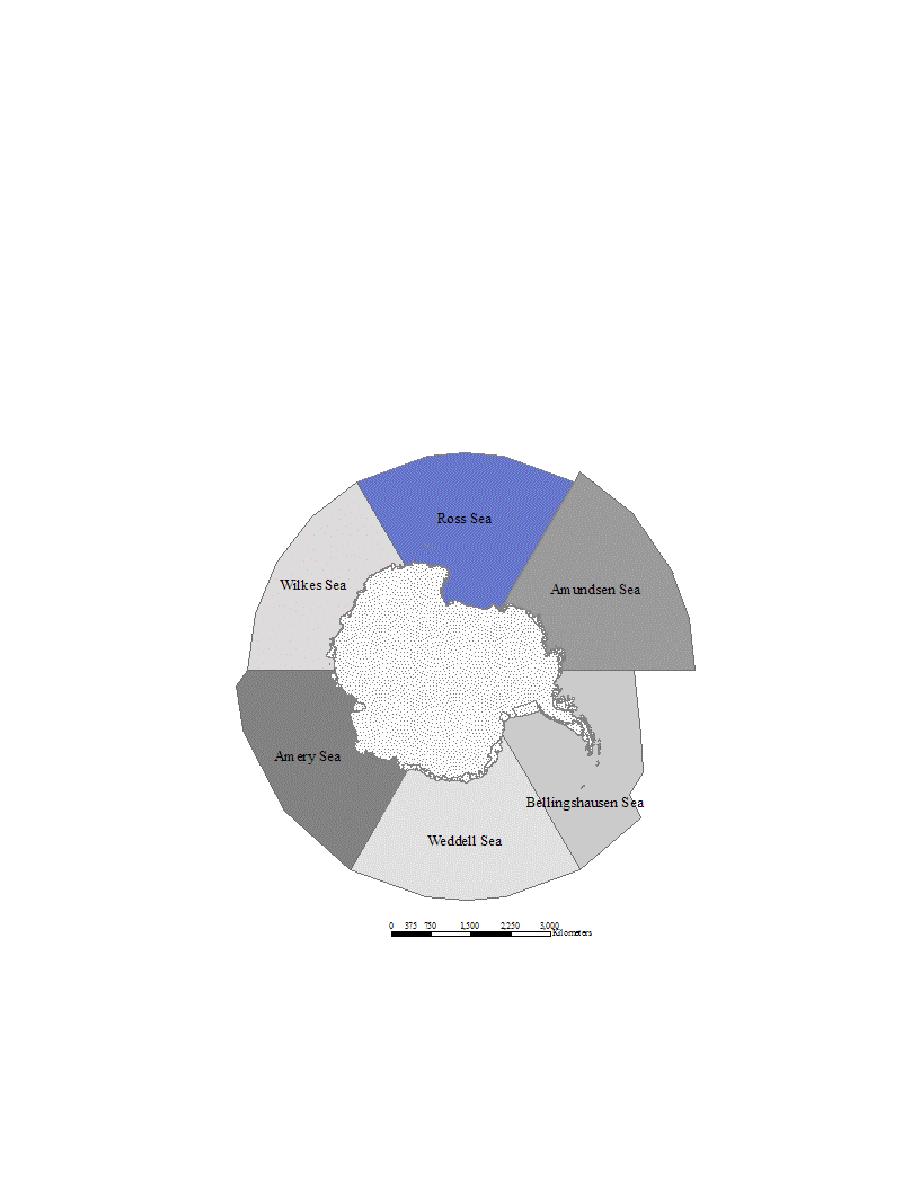
This study focuses on the Ross Sea sector (Figure 1) of the Southern Ocean, which
extends from 150 E longitude to 150 W longitude. It examines two different types of sea-ice
thickness data: ship-based observations and weekly ice chart information.
Figure 1. Area of study includes the Ross Sea in the Southern Ocean.
The Scientific Committee on Antarctic Research (SCAR) developed the Antarctic Sea Ice
Processes and Climate (ASPeCt) program to compile and standardize an extensive archive of
ship observations. The ASPeCt program has identified data collected during 80 voyages


 Previous Page
