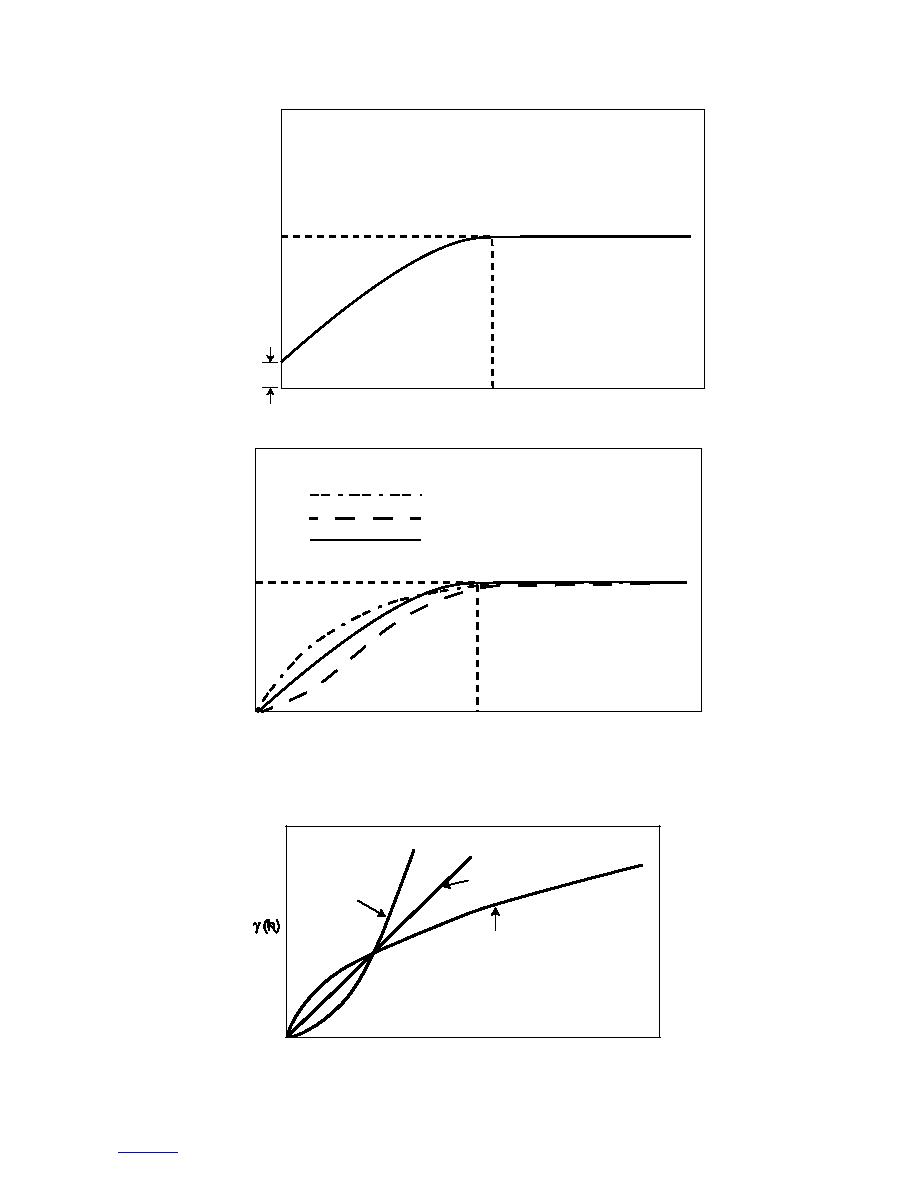
Sill
γ (h)
Nugget
Effect
h
Correlation Range
Figure 13. Sample variogram.
Exponential Model
Gaussian Model
Spherical Model
Sill
γ (h)
h
Correlation Range
Figure 14. Three most commonly used transition models with the same range
and sill (spherical, exponential, and Gaussian).
a=1
1<a<2
0<a<1
h
Figure 15. Power model.
12
to contents


 Previous Page
