200
45
40
160
35
30
120
25
γ (h)
γ (h)
20
80
15
10
40
5
0
0
90
0
10
20
30
40
50
60
70
80
0
30
60
90
120
150
180
210
240
270
h
h
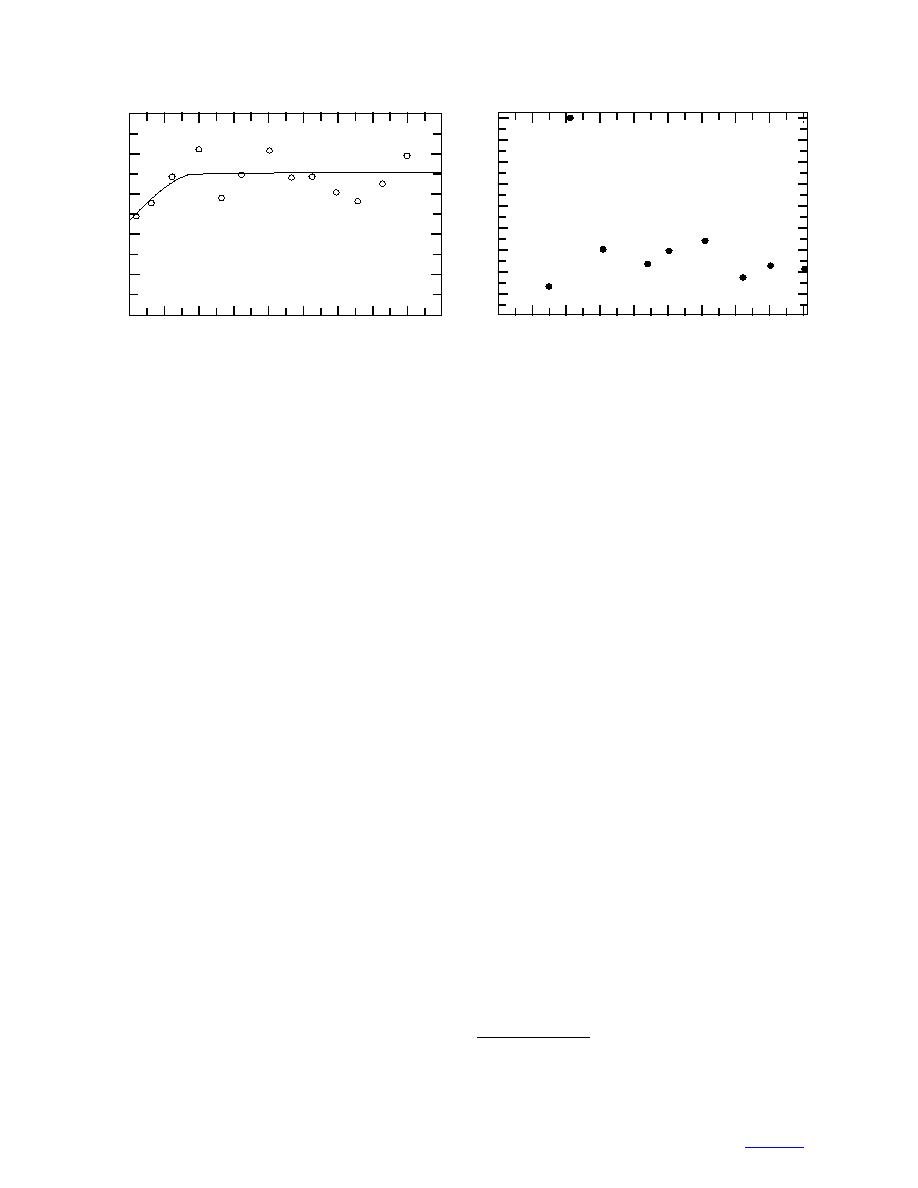
Figure 17. Fort McCoy variogram.
Figure 18. Swan Lake variogram.
Swan Lake, Minnesota
sets increases for the first two sampling dates and
remains constant for the third sampling date. The first
The variogram plots for Swan Lake did not reveal
thaw depth measurements (8 July) on Happy Valley
any spatial correlation. Figure 18 shows a typical vari-
showed no correlation; however, the following two
ogram plot with scattered points. The layout (Fig. 5)
measurements showed a correlation range of 250 and
with a sampling distance of 15 m is too far apart, so
225 m with sill of 110 and 82, respectively (Fig. 16d).
that correlation distance was undetectable. Perhaps a
The sill for West Dock ranged from 110 to 185 with a
shorter sampling distance or a regular sampling grid is
nearly constant range of 400 m (Fig. 16g).
needed to determine the correlation. All the variogram
The variogram plots for Barrow and Toolik Lake
plots for Swan Lake data sets are shown in Appendix
data sets displayed correlation for all data points. The
B1. Solar radiation accounted for 11% of the variabili-
sill and correlation range values were undetermined.
ty in thaw depth across the depression, with more rapid
Barrow exhibits a linear increase in variance with sep-
thaw occurring at locations with greater radiation
aration distance (Fig. 16b). For Barrow a much larger
because of the geometry of the terrain (slope and aspect).
sampling area is needed to discern correlation at these
Most of the lower elevation thawed faster than the high-
separation distances. Toolik Lake variogram also
er areas (Sharratt et al. 1999).
showed a gradual increase in variance starting at 100
FERF
m with a range that cannot be determined (Fig. 16f);
the farther apart the points, the greater the variance.
Best fits were obtained using exponential, power,
Similar to Barrow, a larger sampling area is needed for
and linear variogram models for FERF data sets. The
Toolik Lake to detect the spatial correlation range. Both
typical results from variogram analysis are shown in
Toolik Lake and Happy Valley are near each other and
Figure 19a and b. Plots for all the data sets are located
situated on the foothills, which have similar vegetation,
in Appendix B2. All plots showed that the thaw-depth
slopes, and local weather.
measurements have an increase in variance with separa-
Figure 16e shows the Imnaviat Creek variogram
tion distance; however, the correlation range cannot be
where the statistical variance fluctuated throughout the
determined. Because the distribution of the thaw depth
sampling area with no correlation. The total absence of
gradually slopes across the test section as shown in Fig-
spatial correlation for Imnaviat Creek meant that the
ure 11, the variogram plots tend to have a concave corre-
separation distance or sampling interval of 100 m is so
lation.* The data sets with the largest number of sam-
far apart that one sampling location is unrelated to the
pling points most strongly show this concave behavior.
next at these sites. It also could be due to the terrain
The absence of the sill indicates that the correlation
slope, vegetation, or local weather.
range was larger than the maximum spatial distance of
27 m and a larger sampling area is needed to determine
Fort McCoy, Wisconsin
the correlation distance.
The thaw depths that were measured at Fort McCoy
had a correlation range of 61 m and a maximum statis-
tical variance (sill) of 22 (Fig. 17). The spherical vari-
ogram model is the best fit for these data. This result is
* Personal communication, Dr. Matthew Sturm, CRREL, Fairbanks,
consistent with a similar analysis by Kestler (1996).
Alaska, 2000.
15
to contents


 Previous Page
