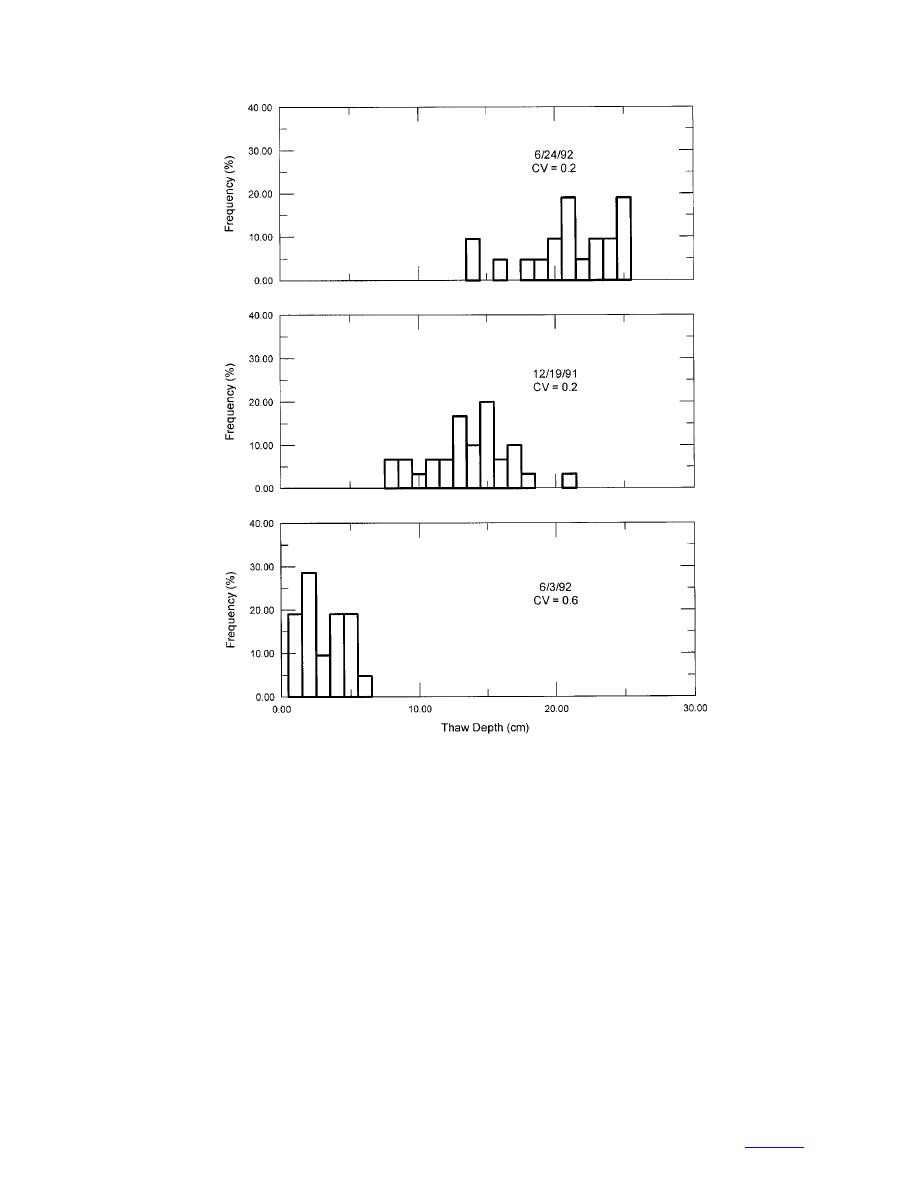
Figure 12. Typical histograms, FERF.
that expresses the statistical variance as a function of
CV of 0.21. This value can be considered indicative of
a bare (no vegetation), homogenous soil in a tempera-
the separation distance. For example, several thaw depth
ture-controlled environment, with no solar input. The
measurements taken at nearly the same point (e.g., point
20) will have nearly the same value, so the variation
CV for Fort McCoy, Wisconsin, was the highest due to
trees present along the sides of the trail (which contrib-
will be small. If spatial correlation exists, sequentially
uted a disparity in shading) and to water ponding and a
increasing the separation distance between data points
stream crossing in some parts of the trail. The variation
will yield a larger variance in the data. This is the pro-
of thaw depth distribution on Swan Lake, Minnesota,
cess used to generate a variogram where separation dis-
tance is plotted on the x-axis and the variance on the
data sets is due to the slope and aspect of the site (Shar-
y-axis. Eq 2 defines the variogram. If the variance
rat et al. 1999). Atquasuk has a higher CV than the rest
increases with the separation distance, then the thaw depth
of the Alaska sites but the reasons are unclear.
is correlated with distance. At the point when an increase
in separation distance no longer causes a correspond-
SPATIAL STATISTICS
ing increase in the variance, the variogram reaches a
Variogram functions to determine the correlation
plateau. The distance corresponding to the start of the
distance for thaw depth were used to analyze the data
plateau is called the range and the variance value at the
plateau is called the sill. The vertical jump of variance
sets. The variogram function is a mathematical model
11
to contents


 Previous Page
