25.0
Atquasuk, Alaska
For All Datasets
Barrow, Alaska
y = 0.3007x
Betty Pingo, Alaska
R2 = 0.7775
Happy Valley, Alaska
20.0
Imnaviat Creek, Alaska
Toolik Lake, Alaska
West Dock, Alaska
Fort McCoy, Wisconsin
t
os
fr
Swan Lake, Minnesota
ma
e
cal
r
Pe
FERF
eS
15.0
rg
La
10.0
ost
afr
rm ale
Pe
ot all Sc
N
Sm
5.0
For FERF Dataset
y = 0.1513x
R2 = 0.1489
0.0
0.0
10.0
20.0
30.0
40.0
50.0
60.0
Average Thaw Depth (cm)
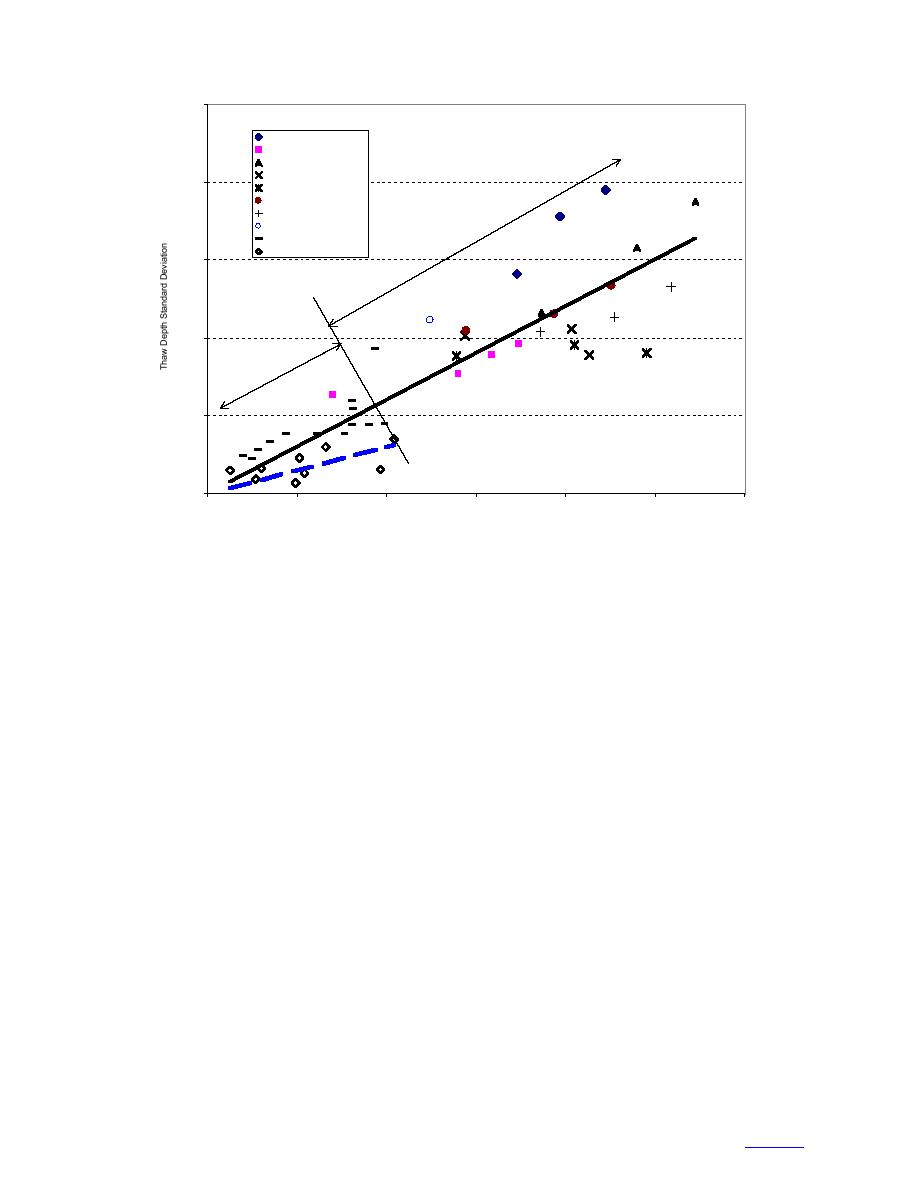
Figure 20. Variability with thaw depth.
installation. These limit the spatial variability analysis
controlled test section with no solar input in the Frost
to determine the correlation range on these sites, and are
Effects Research Facility (FERF) at the Cold Regions
apparent in the variograms.
Research and Engineering Laboratory (CRREL) in Han-
Solar radiation is one of the influence factors for
over, New Hampshire.
slopes with varying orientation and gradient. Thus, the
Variation in elevation, slope, aspect, vegetation, and
change in solar radiation accounts for some of the varia-
solar radiation contribute to the variation in thaw. Coef-
bility in the Alaska sites on the foothills (Nelson et al.
ficients of variation ranged from very low values of 0.1
1997), and in the Swan Lake, Minnesota, site (Sharrat et
at the controlled site (FERF) to 0.5 and 0.6 at sites with
al. 1999).
non-uniform elevation, slope/aspect, vegetation, or sur-
The correlation range on Table 2 can be used as an ini-
face water. Spatial statistic analysis of the thaw depth
tial approximation for the specific terrain. For example, in
data show that the correlation range at each site stays
the case for seasonal thaw depth without permafrost, the
constant as thaw progresses. The correlation range at
correlation range can be estimated at about 61 m.
each site can be used as a first approximation for esti-
These results can be used for analysis of the impact
mating correlation of similar sites. The terrain and sur-
of thaw distribution on predictive models, such as for
face energy factors were not specifically addressed,
predicting vehicle mobility. Future research should
making broad generalization regarding the impacts of
include evaluation of impact of climate, vegetation, sur-
specific factors difficult.
face roughness, solar radiation, and slope on thaw vari-
Even with the wide differences among sites, the stan-
ability, and how they change with time.
dard deviation tends to increase smoothly with thaw
depth. A compilation of all data (Fig. 20) shows an
increase according to
SUMMARY
σthaw = 0.03007 mthaw.
Statistical and spatial analyses were performed on
(9)
existing thaw depth data sets from a variety of climatic
and terrain conditions to determine the variability of
Most data fit this trend with the controlled site having a
thaw. These data include permafrost sites in Alaska, tem-
slightly smaller slope. Because the Alaska sites were
perate sites in the continental United States, including
underlain by permafrost, most of the deepest thaw
sites in Minnesota and Wisconsin, and a large-scale,
depths were collected in this environment.
17
to contents


 Previous Page
