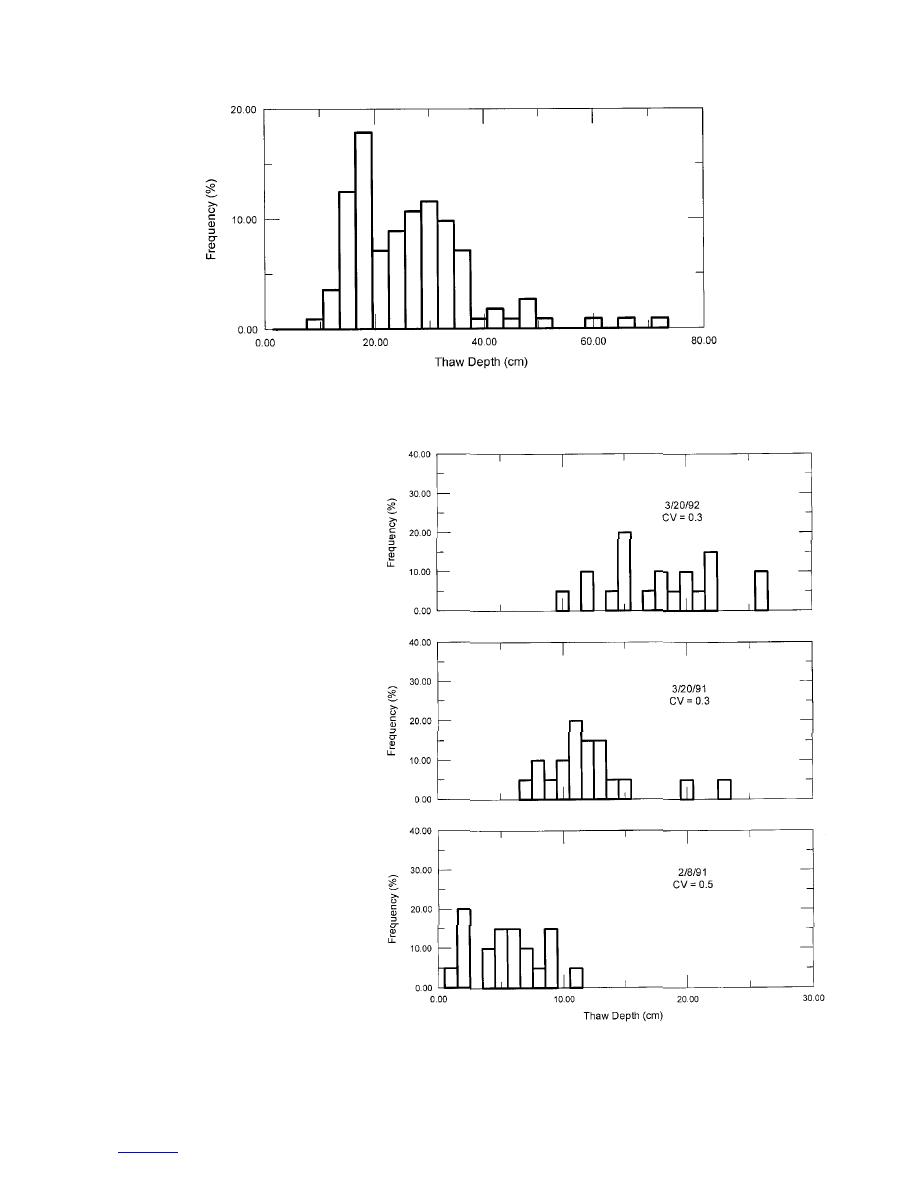
Figure 8. Fort McCoy thaw-depth histogram.
thaw depth variations were due to the in-
fluence of variations of solar radiation and
topography (slope and aspect). Because
of the shallow depression, the southern-
facing slope gains more intense sunlight
during part of the day while the northern-
facing slope gets the self-shadowing ef-
fect. Sharrat et al. (1999) mentioned that
rapid thawing at location 9 and possibly
location 5 occurred when water was
present in the center of the depression. The
progression of thaw with time is shown
in Figure 10, showing anomalous thaws
at locations 5, 9, and 20. In general the
thaw depth progressed downward evenly
with time.
FERF
The average thaw depth for the FERF
data sets ranged from 2.5 to 20.8 cm. Stan-
dard deviations ranged from 1 to 3.5 cm
(Tables 2 and 3). For all data sets, the thaw
depth is higher at one end of the test basin
(Fig. 11). This is true for most of the data
sets in the FERF, and is probably due to
changes in the air temperature and frost
properties at the north end of the test sec-
tion where the floor of the test basin ramps
up toward the building entrance. Figure
12 shows the histograms for three of the
thaw events.
COMPARISON OF SITES
A comparison of variability at each site
Figure 9. Typical histograms, Swan Lake.
is given in Table 2. The FERF data sets
showed the lowest CV, with an average
8
to contents


 Previous Page
