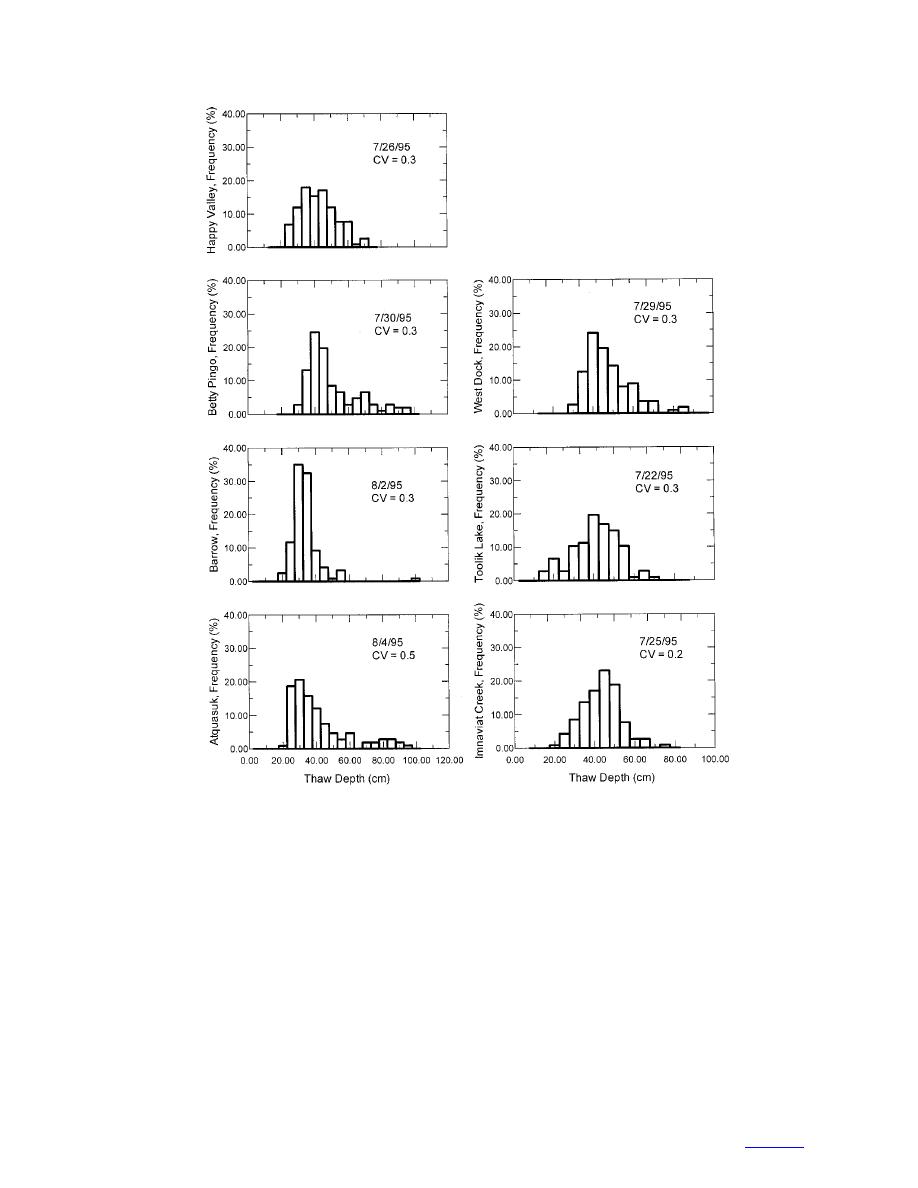
Figure 7. North Slope thaw-depth histogram.
Fort McCoy, Wisconsin
standing water and 300 was used for rocks, gravel,
roads, etc. These codes were culled for our analysis.
A histogram for thaw depths on the trail at Fort
All seven sites have a very low coefficient of variation,
McCoy showed scattered distribution with a wide range
ranging from 0.2 to 0.5, indicating minimum variation
and CV of 0.5 as shown in Figure 8. Table 3 shows the
in the data sets.
minimum and maximum thaw depth. As the data were
The histograms for Atquasuk, Betty Pingo, and West
collected for only one date, no temporal comparisons
Dock are somewhat skewed with a long tail of high
are possible.
thaw-depth values. The skewed data sets were located
Swan Lake, Minnesota
in the coastal areas with relatively flat terrain; howev-
er, it is unclear how these factors may have affected the
The coefficient of variation for the 13 data sets from
distribution. Thaw depth for Barrow, Happy Valley,
Swan Lake, Minnesota, varied from 0.2 to 0.6 (Tables
Imnaviat Creek, and Toolik Lake more closely resem-
2 and 3). Figure 9 illustrates typical histograms for the
ble a normal distribution. These behaviors are consis-
data sets and all of the data histograms are shown in
tent for all data sets for each site (App. A).
A8. The thaw depths showed spread distribution. These
7
to contents


 Previous Page
