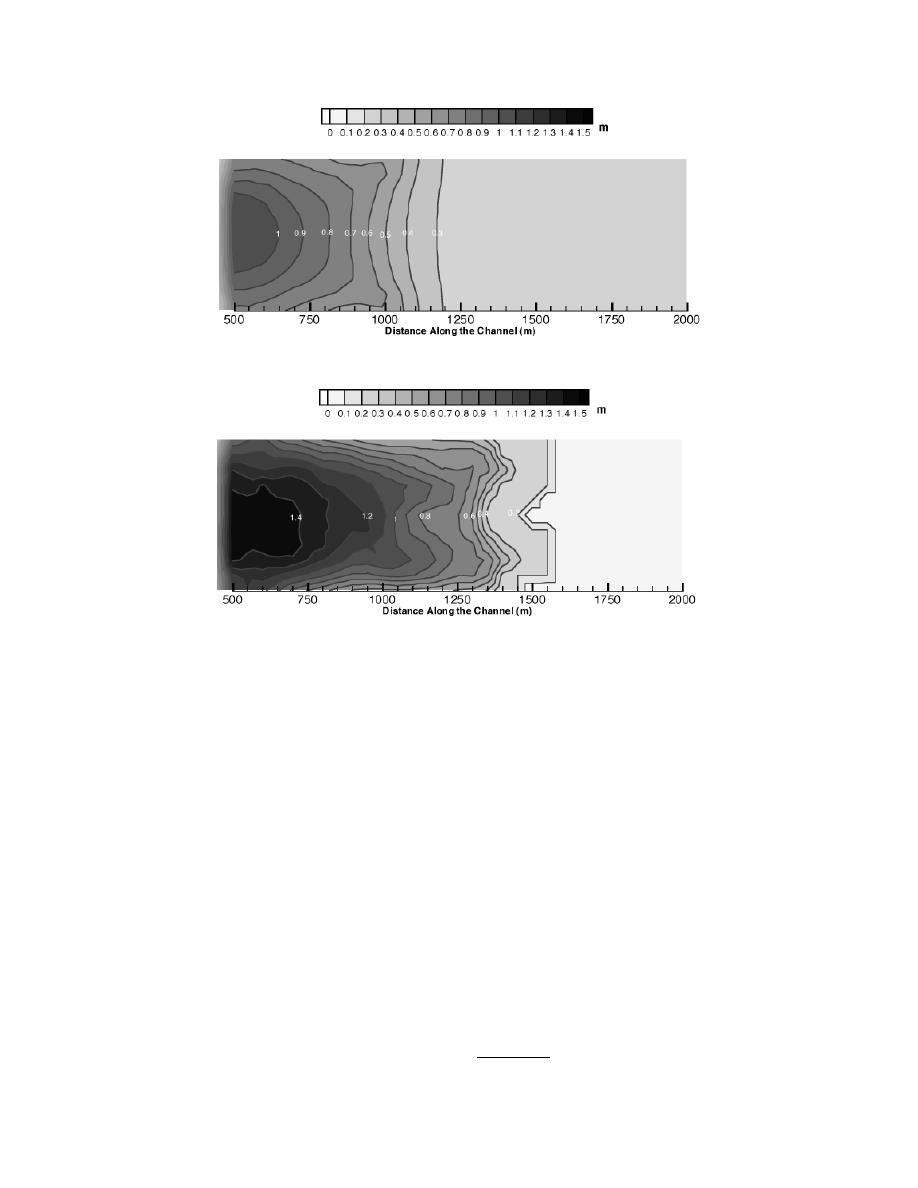
a. Hour 1.
b. Hour 4.
Figure 9. Ice thickness distributions.
and the empirical constant j in eq 37 had to be validated.
gaging data. The present hydrodynamic model is
The MRD ice data spread sheets for the January 1977
calibrated to the HEC-2 results.
ice event give the daily position of the leading edge of
In a one-dimensional study of ice jamming on the
a freezeup ice jam that progressed upstream during 17
Missouri using the ICETHK model, Tuthill found two
22 January 1977. Using an average flow of 650 m3/s
possible locations where an ice boom may be used: RM
(23,000 ft3/s), φ = 45, 2 = 1.17, and ni = 0.04, the
16 and RM 8.2. For computational efficiency, two model
domains are used for these two boom sites. Domain 1
ICETHK model simulation, with the ice jam toe placed
covers RM 1320 and domain 2 covers RM 513. The
below the confluence at RM 193.8 of the Mississippi
finite-element mesh and bed elevation for domain 1 are
River, gives an average ice jam thickness of about 0.9
shown in Figure 10. Similar plots for domain 2 are
m (3 ft) upstream of RM 8 on the Missouri River.* The
shown in Figure 11. The two-dimensional model water
ICETHK model is a one-dimensional steady-state
surface profiles are compared to HEC-2 water levels in
model, which calculates the ice thickness profile of a
Figure 12. The Manning's coefficients for the bed are
wide-river jam based on an ice jam force balance that
shown in Table 2.
is similar to the model of Flato and Gerard (1986).
Assuming an ice jam porosity of 0.4, we determined
Simulation of the January 1977 Missouri River
the average ice discharge upstream of the jam to be
about 13.5 m3/s (475 ft3/s) to account for this observed
Ice Jam
Manning's coefficients for the river bed were
upstream progression. Assuming a floe thickness of 0.15
determined by the open water calibration in the last
section. The Manning's coefficient for the ice cover had
to be calibrated, and the internal friction angle of ice φ
*Personal communication with A. Tuthill, CRREL, 1997.
14


 Previous Page
