130
128
q = 1698 m3/s
126
124
q = 566 m 3/s
HEC-2
2-D model
122
13
14
15
16
17
18
19
20
River Mile
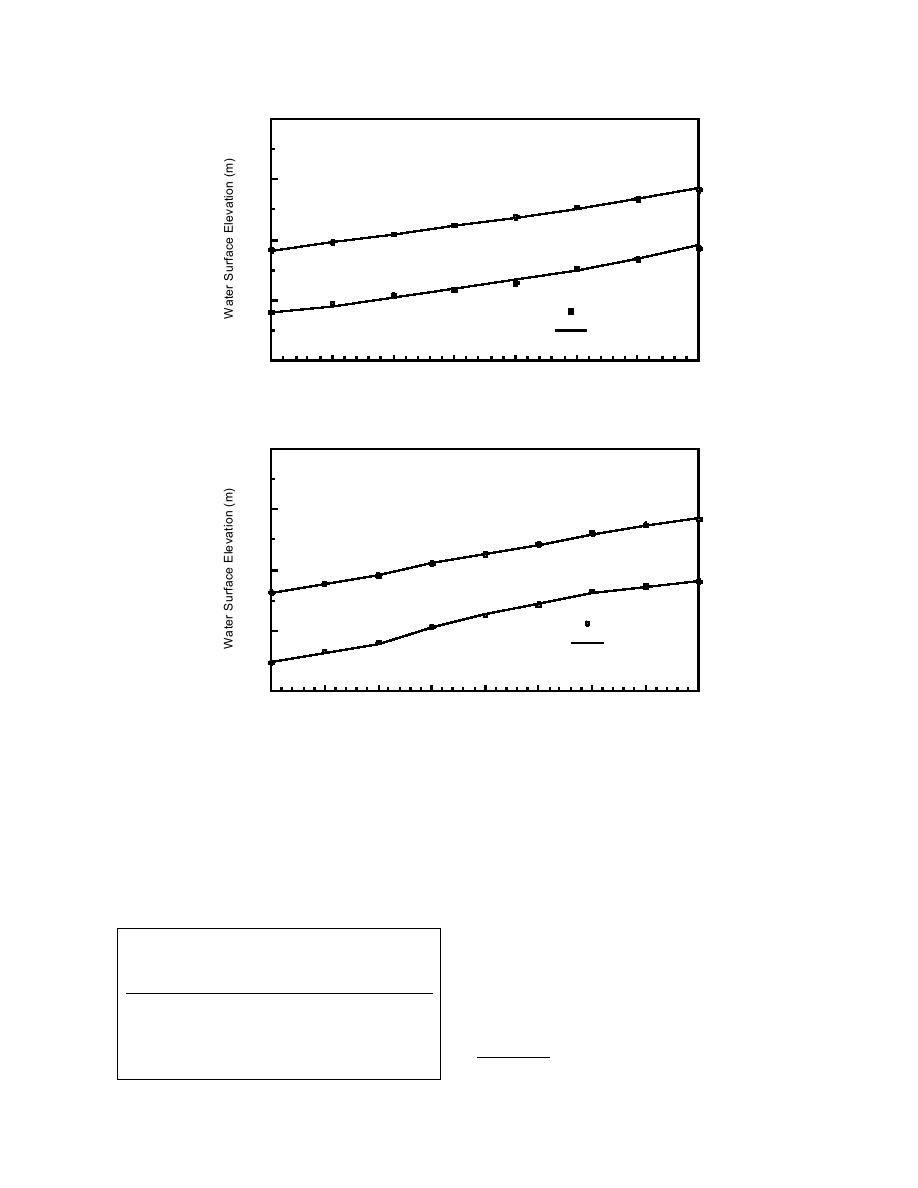
a. Domain 1 (RM 1320).
128
126
q = 1698 m3/s
124
HEC-2
122
3
q = 566 m /s
2-D Model
120
5
6
7
8
9
10
11
12
13
River Mile
b. Domain 2 (RM 513).
Figure 12. Comparison of ice-free water surface profiles.
February 1989, and 16 December 1989. These photos
m (0.5 ft) and an ice velocity of 1.2 m/s (4 ft/s), we
showed surface ice concentrations of 20 to 30%.* On
estimated the surface concentration of the moving pans
the basis of this ice discharge estimate and a downstream
and floes to be about 30%. This estimate compares
water surface elevation estimated by the ICETHK
reasonably well with aerial photographs of moving ice
model, the ice accumulations behind the booms at RM
at the mouth of the Missouri on 9 January 1979, 9
16 in domain 1 and RM 8.2 in domain 2 were simulated
by the present two-dimensional model.
Table 2. Calibrated bed roughness.
Simulation with a boom at RM 16
The downstream boundary water level for domain
Manning's n for bed
RM
1 at RM 13 was obtained by making the simulated water
level at boom location RM 16 the same as the ICETHK
57
0.022
79
0.020
model result, which was 128 m (420 ft). The Manning's
911
0.015
1113
0.015
1320
0.019
*Personal communication with A. Tuthill, CRREL, 1997.
18


 Previous Page
