2
2-D Result
1-D Result
0
1.06 m
Ice Cover
-2
-4
River Bed
-6
0
200
400
600
800
1000
1200
1400
1600
1800
2000
Distance Along River (m)
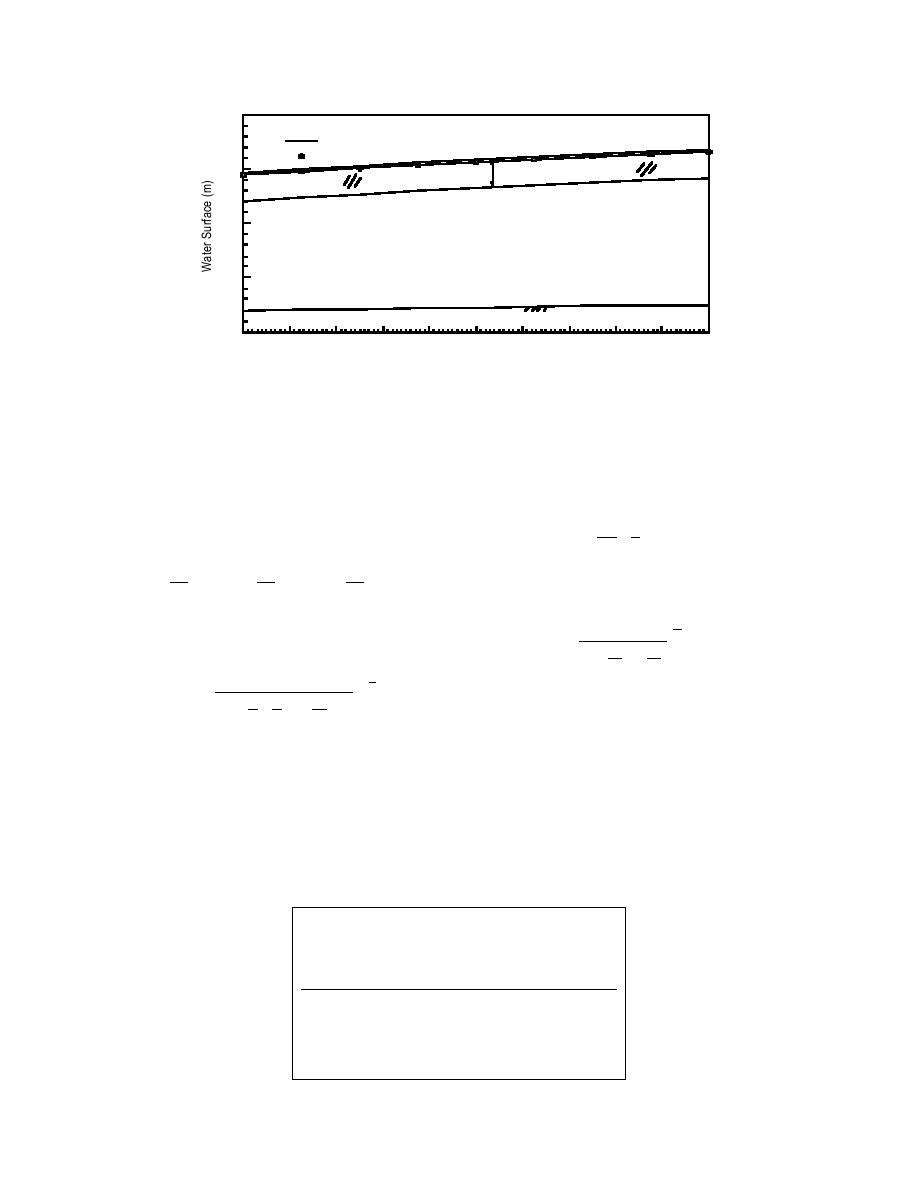
Figure 6. Comparison of water surface profiles.
Without bank friction
With bank friction
An analytical solution for the width-averaged ice
The steady-state ice thickness profile can be obtained
jam thickness profile can be derived by extending the
by simplifying the momentum equation, eq 22. When
only the water drag in x-direction, i.e., Fwx = ρcwVwx ,
2
solution of Pariset and Hausser (1961).
is considered and the bank friction is neglected, the ice
21 1
momentum equation is simplified to Rx + Fwx = 0. The
-
x
ti = teq (1 - e
B )2
(51)
internal ice resistance reduces to
where B is the channel width and the equilibrium ice
Rx =
(σ xx Nti ) +
(σ xy Nti ) =
( PNti ) . (49)
thickness is
x
y
x
Using eq 37 for the pressure term leads to a simple
1
2
(52)
BNCwVwx
teq = (
analytical solution for the static ice accumulation
)2
ρi
ρi
(1 -
g2
thickness profile
)
ρ
ρ
2ρcwVwx
2
1
where
ti = (ti2
+
2
x)
(50)
0
ρi
φ
tan2 ( π + )(1 -
)ρ g
2 = N tanφ(1 + sinφ)
ρ i
4
2
and
in which ti0 = single layer ice thickness and x = distance
1 = tanφ(1 sinφ) (Beltaos 1995)
from the leading edge of the jam where ti = ti0. The
simulated results and analytical solution are compared
For
in Figure 7. Figure 7a shows progressive thickening
φ = 46
and compressing of the simulated ice cover with time.
2 = 1.068
Figure 7b compares the analytical solution to the
1 = 0.29.
simulated ice thickness profile on and after t = 4 hours.
Table 1. Parameters used in the ice dynamic
simulation.
Parameter
Description
Value
Maximum ice concentration
0.6
Nmax
φ
46
Internal friction angle of ice
tan φ
Boundary friction coefficient
1.04
Empirical constant
15
j
Water drag coefficient on ice
0.02
cw
11


 Previous Page
