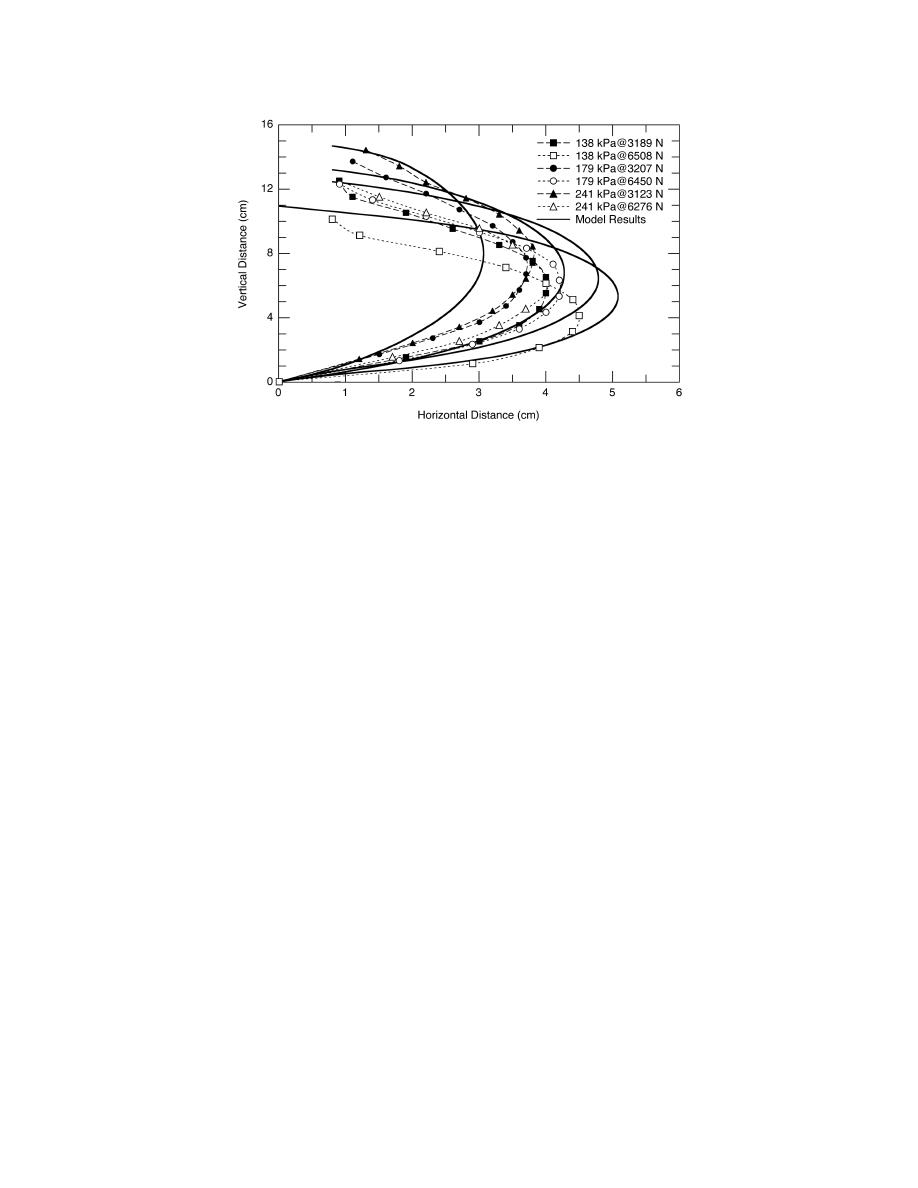
Figure 55. Measured and modeled sidewall profiles for the Shoop
Darnell tire model.
Run times
actual tires and the models where the rubber tread
Model efficiency is of primary importance for use
elements conform to the surface, softening the con-
in rolling a tire on a deformable material, so the mod-
tact. For our purposes, this behavior disappears when
els were run with various options and using different
the tire model is applied to a terrain surface, which
computers in order to assess the effects on run time.
softens the contact through terrain compliance.
The primary variables considered were the effect of
Sidewall profile
the tread (smooth vs. ribbed), static or dynamic
analysis, convergence controls, optimum use of sym-
Measurements of the deflected shape of the side-
metry, and computing system. The results of the
wall under various loads and inflation pressures were
many runs are included in the following discussions
collected to check the calibration of the Shoop
and qualitatively summarized in Table 10. Examples
Darnell tire sidewall model. Selected measurements
of some of the run times are given at the bottom of
of the profiles, along with comparisons to the mod-
the table. Consideration was also given to how far the
eled geometry, are given in Figure 55. The modeled
tire would roll in the model run. A roll distance of
sidewall geometry closely duplicates the measured
between one third and two revolutions, depending on
geometry. The modeled sidewall is slightly longer
the tire, is needed to remove abnormal stresses built
than the measured profiles since the measurements
up in the tire structure due to lowering it onto the
did not include the sidewall portion covered by the
surface. One revolution was considered the minimum
wheel rim.
requirement. All comparison simulations were done
Hard-surface rolling resistance
using the implicit solver.
Static vs. dynamic. The static models were run in a
Ideally forces generated from rolling the model
steady-state type of analysis. The same models were
should be comparable to the measured hard-surface
modified for a dynamic analysis where the inertia of
rolling resistance. However, rolling resistance is
the system is considered. In general, the static models
largely due to viscoelastic behavior in the rubber
roll over twenty times farther in less than twice the
compounds, and these models omit the viscoelastic
CPU time than the dynamic models. However, the
material properties for increased efficiency. There-
dynamic models used less memory. Ultimately, a
fore, the modeled hard-surface rolling resistance
dynamic model is the desired choice to include mass,
forces reflect only resistance due to interface shear.
velocity, and acceleration effects and for operating
For an interface friction coefficient of 0.825, similar
the combined model using an explicit finite element
to asphalt pavement, the rolling forces modeled are
code.
less than 10 N at an inflation pressure of 241 kPa,
Full tire vs. half-tire. The full-tire version of the
while measured values are on the order of 25 N [at
ribbed model is prohibitively expensive in terms of
241 kPa and low speed (8 kph)].
40


 Previous Page
