Evaluation of tire models on a rigid surface
241 kPa (35 psi), 179 kPa (26 psi), and 103 kPa (15
psi). The suggested inflation pressure for these tires is
The tire models were applied to a rigid surface
241 kPa. Lower inflation pressures are sometimes
through a range of pressures and loads for compari-
used when driving in off-road and marginal road
son to measured deflections, contact patch areas, di-
conditions (snow and soft soil) and for minimizing
mensions, and stresses.
damage to unpaved travel surfaces. Therefore, the
Deflection
two lower inflation pressures were also evaluated.
Performance at a range of inflation pressures is also
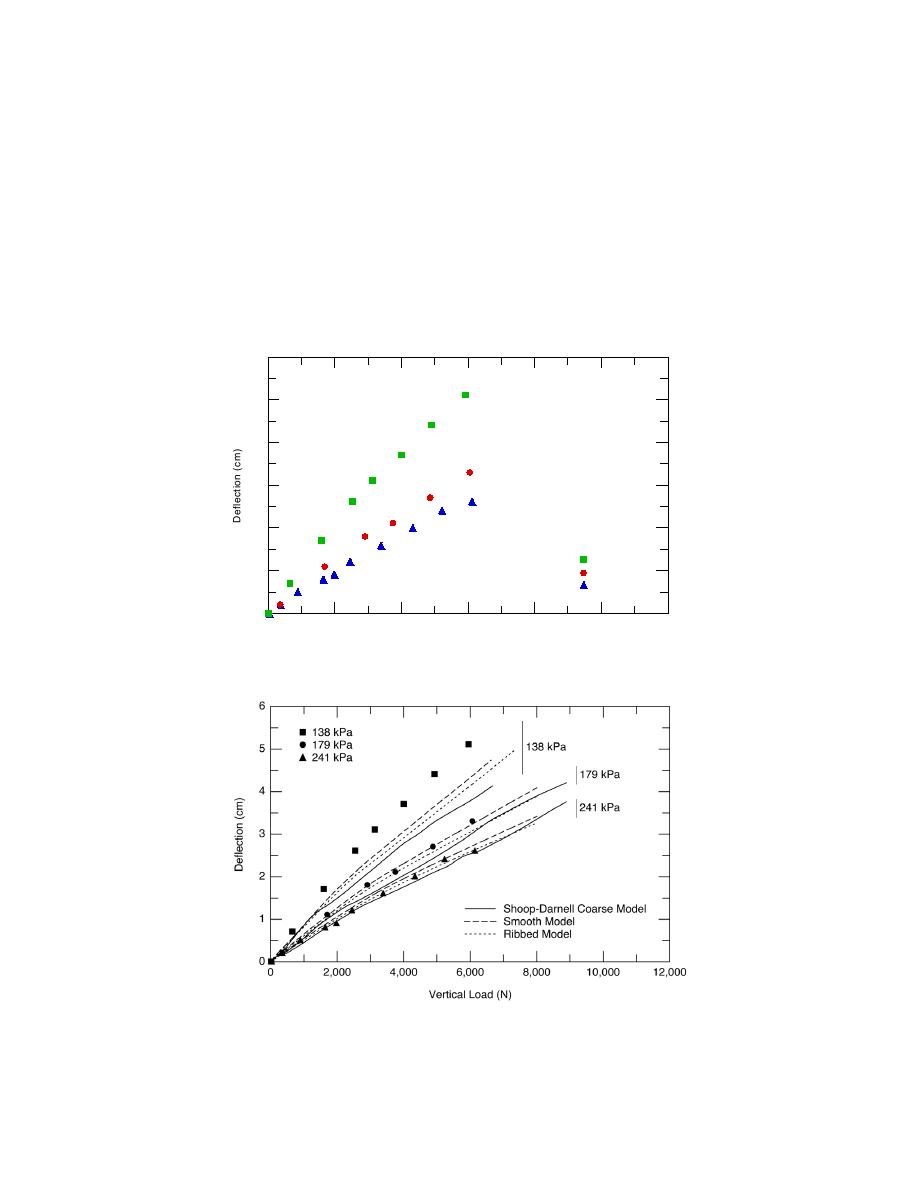
A complete data set for deflection was gathered
of interest to industries using vehicles with Central
for the Wrangler AT (Fig. 45) for use in comparisons
Tire Inflations Systems (CTIS) (i.e. military, forestry,
with model results from the ShoopDarnell model,
and agriculture).
the smooth tread model, and the ribbed tread model.
A compilation of the data and model results for
Each model was loaded at a range of vertical loads
each inflation pressure is shown in Figure 46. The
(from 0 to 8000 N) at three tire inflation pressures:
6
5
4
3
2
103 kPa
1
179 kPa
241 kPa
0
0
2,000
4,000
6,000
8,000
10,000
12,000
Vertical Load (N)
Figure 45. Measured deflection for three tire pressures.
Figure 46. Comparison of measured and modeled deflection for the
ShoopDarnell, smooth tread, and ribbed tread models for three infla-
tion pressures.
35


 Previous Page
