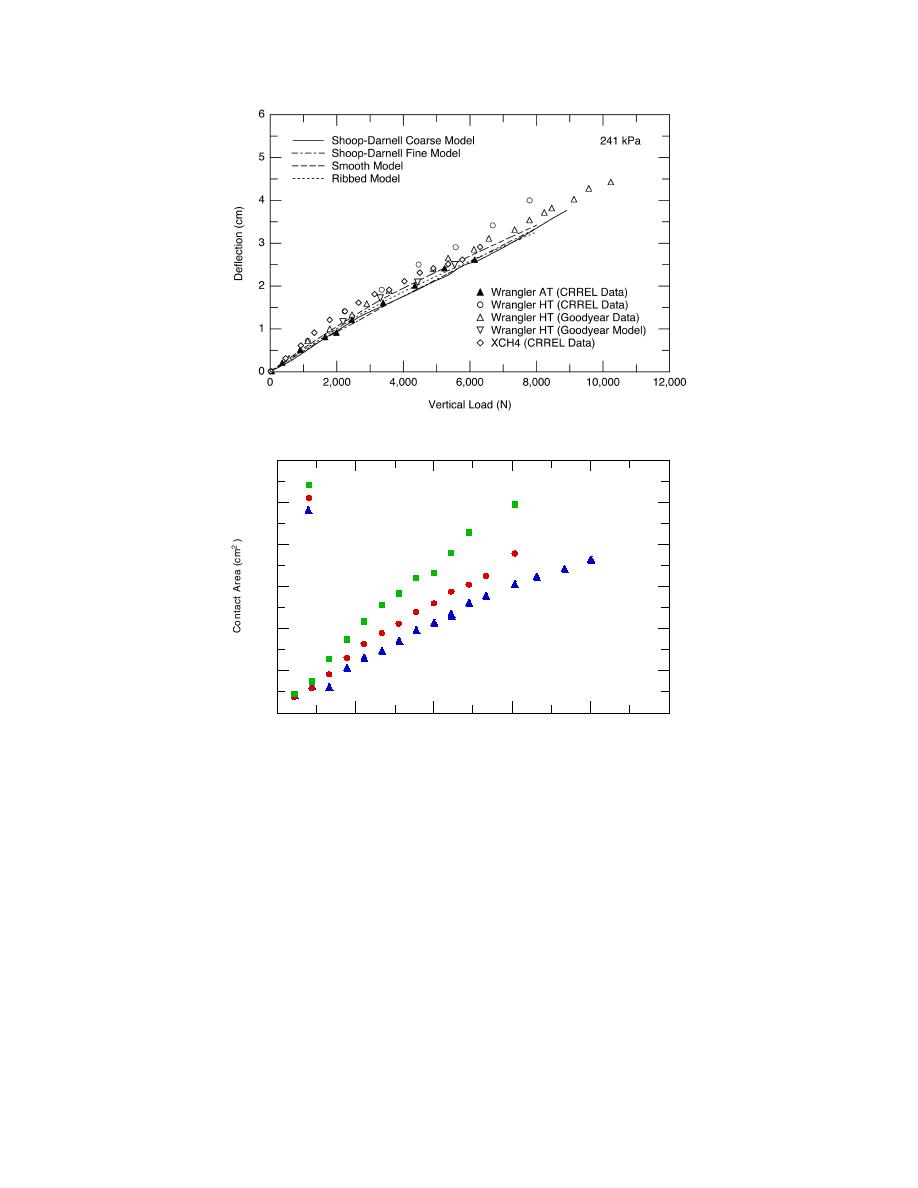
Figure 47. Comparison of all measured and modeled deflections at
241 kPa (35 psi) inflation pressure.
600
103 kPa
179 kPa
500
241 kPa
400
300
200
100
0
0
2,000
4,000
6,000
8,000
10,000
Vertical Load (N)
Figure 48. Measured contact areas at three inflation pressures.
contact areas for the three inflation pressures are
model predictions follow the same general trend as
given in Figure 48. All contact areas are based on the
the data for all tire pressures, with the largest differ-
perimeter of the contact, without accounting for voids
ence occurring at the lower inflation pressure. This is
within the area due to tread design. Comparisons of
understandable since undesirable tread and sidewall
the model results (the ShoopDarnell model with
behavior can occur when tires are underinflated, and
both coarse and fine mesh, the smooth tread model,
these pressures and behaviors are neither within the
and the ribbed tread model) with measured data are
design range nor accurately accounted for in the
shown in Figure 49.
models. On the other hand, the agreement between
In general, the agreement between the models and
data and models at the standard inflation pressure is
data is reasonable. Surprisingly the Darnell gives the
exceptionally good, as illustrated in more detail in
best fit, but the model mesh is coarse, which makes
Figure 47, showing all measured and modeled deflec-
the results erratic since the contact area changes
tions at 241 kPa.
abruptly as each shell element makes contact. The
Contact area
refined mesh on the Darnell model is only a slight
improvement, and the results are worse at the higher
Comparisons of contact area were done much the
loads where the contact nodes pop off the surface just
same as the deflection comparisons. The measured
36


 Previous Page
