10
Run 2
Run 3
Porous Plate
8
6
K = 1 1018
4
K = 4 1019
2
0
30
0
6
12
18
24
Days
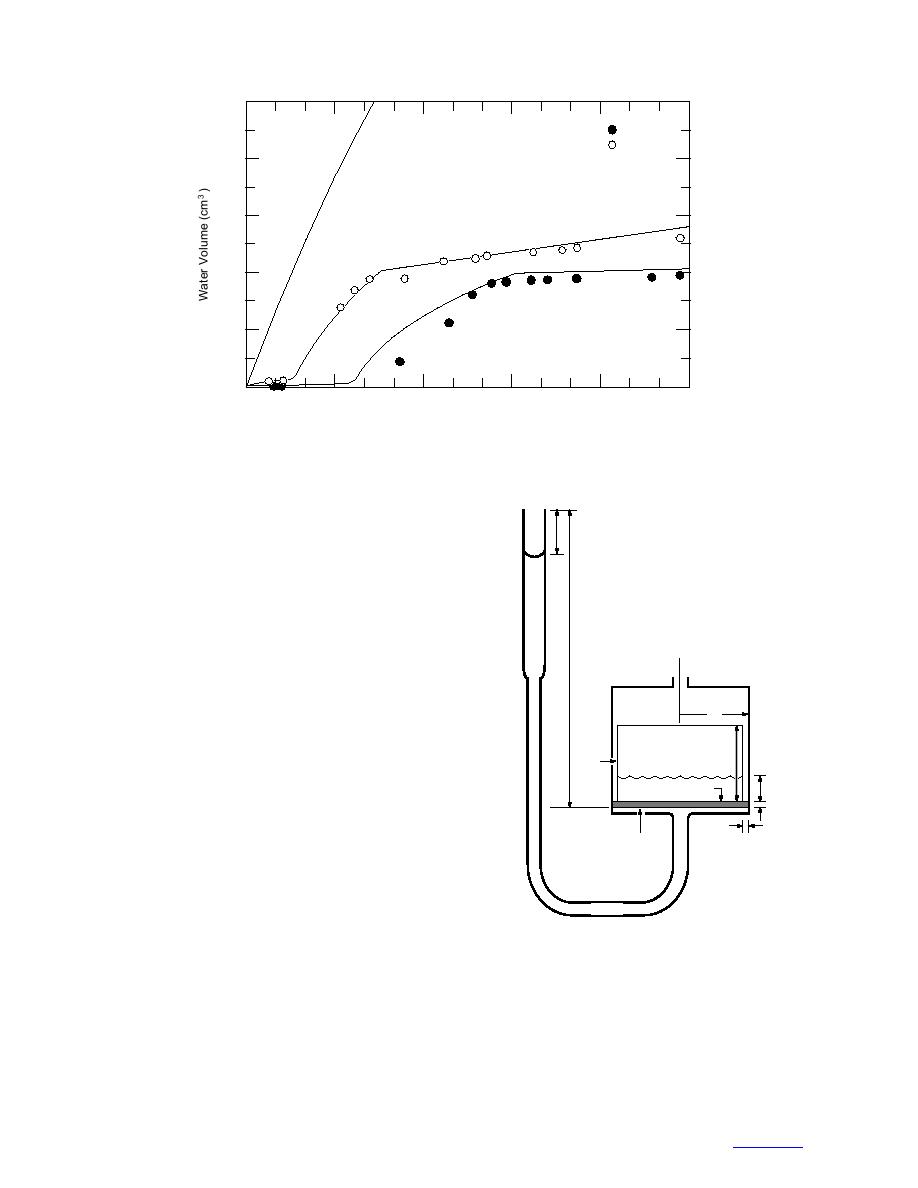
Figure 11. Days vs. volume of water re-entering Sample B. Solid circles are for
run 2 and open circles for run 3. Lines show computed flow rates for the porous
plate alone and for hypothetical configurations of the ice sample.
on Sample B. Gauge pressure had been reduced to zero,
but the height of water in the pipette created a pressure
z
head at the bottom of the sample. In both data plots,
water re-entry is at first quite slow, rises quickly for the
next week or so, and then returns to a slower rate.
Although it is possible that melt-induced structural
changes caused this flow variation, bath temperatures
were fairly steady over both time periods. Because the
data plots are smooth and consistent, we attempt to
h0
model the water flow and thereby gain insight into the
ice permeability. Figure 11 shows computed flow rates
Air
Rc
for the porous plate alone and for hypothetical configu-
rations of the ice sample.
Ice Core
Figure 12 shows the simplified structure we assume
hi
Air
for the analysis: a cylindrical stackup of the porous plate
Gap
and a slightly narrower ice core, subject to a pressure
Water Front
z
Plate
head at the bottom of the porous plate. The initial gravi-
hp
tational head is a height h0 of water in the pipette. The
receding water level z′ in the pipette relates to the ris-
Water/Ice
tg
ing level z in the sample as z′ = φAr z, where Ar is the
ratio of the sample area to the pipette area and φ is the
ice porosity ahead of the water front. We assume a one-
dimensional treatment, but note that this is valid only
Water
in the absence of a radial pressure gradient beneath the
plate. A uniform pressure head is possible if the resis-
Figure 12. Idealized ice configuration used in flow
tance-wire heater (Fig. 1) kept the area beneath the plate
computations. Not to scale.
from totally freezing. If this area were instead blocked
by ice, we estimate that the radial gradient would slow
the upward velocity of the water front by roughly one-
seventh (e.g., Muskat 1937).
We model the water flow with Darcy's law:
11


 Previous Page
