100
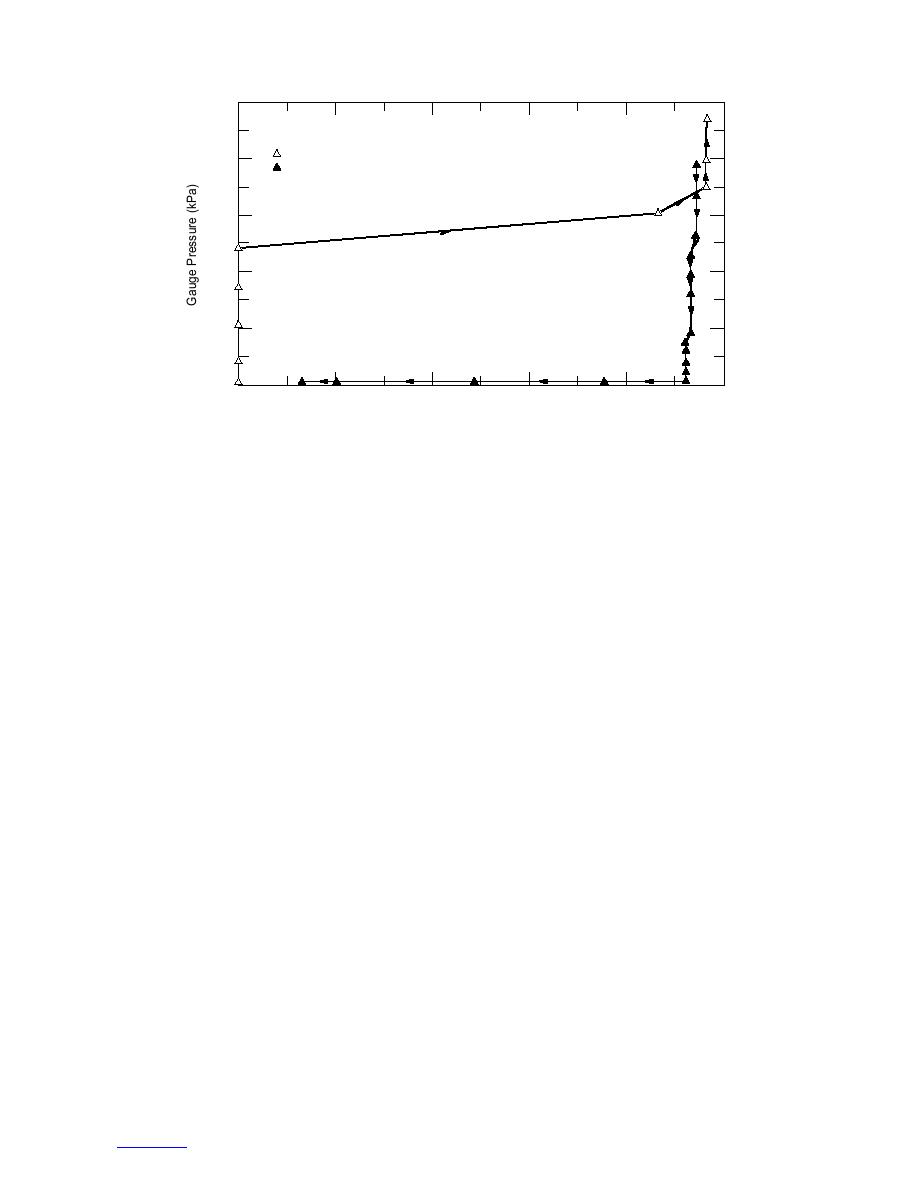
Bath Temperature = (0.03C) to (0.01C)
Drying
80
Wetting
60
40
20
0
5
0
1
2
3
4
Water Removed (cm3 )
Figure 10. Volume of water exiting (open triangles) and re-entering (solid
triangles) Sample B vs. gauge pressure (pg) for bath temperatures between
0.03C and 0.01C. The bath temperature warmed to 0.005C for approximately
two hours at a pressure level of 61 kPa.
We thus endeavored to refine the experiment by creat-
of water. On the return phase, the water level decreased
overall by 0.2 cm3 as the gauge pressure was decreased
ing a purer and more homogenous sample and by moni-
toring the bath temperature more closely. For the sec-
to 4 kPa. The first drop at 80 kPa corresponds to a very
small grain diameter of 2 m. If the spread in vein di-
ond experiment, we rotted Sample B for one month at
0.05C to 0.06C and then began the first of four
ameters is again tenfold, this implies a maximum size
of around 20 m, consistent with run 1. With the gauge
pressure cycles. None of these were particularly suc-
cessful. In the first run, we incremented gauge pres-
pressure at 0, water slowly re-entered the sample over
sure to 83 kPa and back with only minor changes in
the next month.
water level. On the drying curve the water level
During the last week of the previous run, the bath
temperature had warmed to near 0.01C. Thus when
increased by 0.05 cm3 at a pressure of 34 kPa and on
return curve it decreased by about half this amount when
we increased gauge pressure to 10 kPa to begin run
three, we immediately removed over 9 cm3 of meltwa-
the pressure was reduced. The corresponding vein width
of 20 m is consistent with a molality of 1 106 moles
ter in just a few hours. We reduced the pressure to 0
kg1. The tolerances in water level are so small, how-
and all but 2.8 cm3 again re-entered the sample over
ever, that we cannot attribute much significance to this
the next month.
value.
For the final run, the bath temperature was mostly
between 0.02C and 0.01C. About 2 cm3 of water
For the second run we increased the bath tempera-
ture to 0.03C to obtain greater vein dilation. Figure
was removed at a gauge pressure of 17 kPa. An addi-
tional 7 cm3 were removed as we incremented the gauge
10 shows the results of this run. For the first pressure
increments the water level decreased slightly, reminis-
pressure to 93 kPa. Because of the sizable amounts of
cent of this anomalous occurrence for the second run
water, surface melting most likely contributed to the
water volume. This close to the 0C, pressure melting
on Sample A. The 4.3-cc rise in water level at a pres-
sure of 60 kPa occurred when the bath temperature
becomes significant and could account for additional
approached 0C and slightly exceeded it for about an
meltwater with increasing gauge pressure. No water re-
hour. At the time of observation and during most of the
entered the sample on the depressurizing cycle or dur-
elevated period, the temperature was around 0.01C.
ing the following week at 0 gauge pressure.
water is around 0.001C for the dirtier part of sample,
PERMEABILITY
surface melt undoubtedly contributed to this volume.
After returning the bath temperature to 0.03C, we
Data points in Figure 11 show a time series of water
incremented the pressure to 94 kPa with no further loss
re-entry volumes for the final months of runs 2 and 3
10


 Previous Page
