0.8
Molality = 0.005
0.6
0.001
0.4
0.0001
0.2
0.00001
0.000001
0.0
0.08
0.06
0.04
0.02
0.00
0.10
Temperature Depression (C)
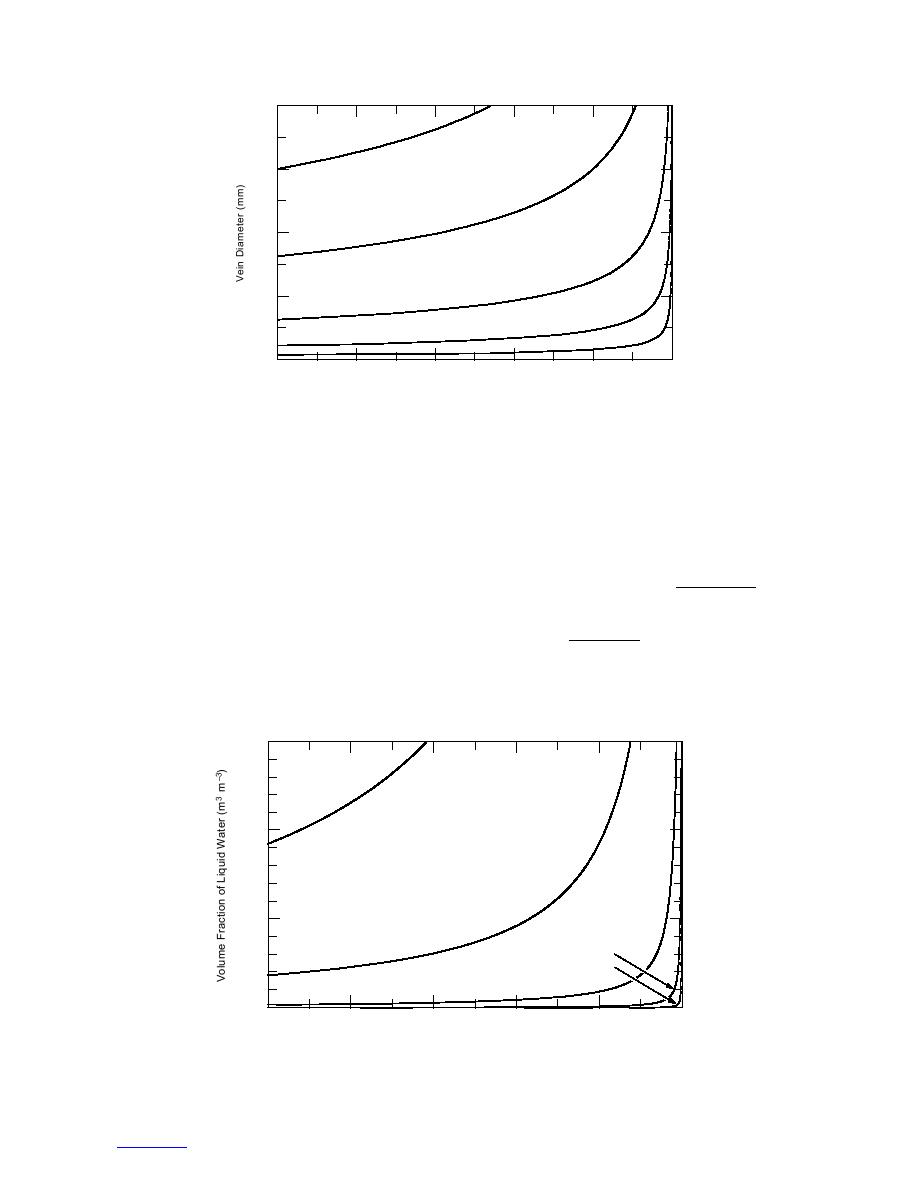
Figure 6. Vein diameter vs. equilibrium temperature for a range of vein
bulk molalities mv. Computed from eq 3, where G = 0.0032 m and pG = 0.
(0.5SvvL), where Sv is the surface-to-volume ratio of
shows vein diameter dv (= 0.4838 rv) as a function of
an ice grain, rL is the radius of the lens interface, mL is
temperature for a range of molalities that bracket our
the lens bulk molality , and vL is the lens volume. Again
samples and Figure 7 shows the corresponding volume
using the relationships in Table 1, the depression tem-
fraction of liquid water. The impurities term dominates
the curvature term below about 1 105 C. For these
perature for a lens is
plots, the gauge pressure (or excess air pressure) is taken
5.570 10 -8
∆TL = -7.413 10 -8 pG -
as 0. At the maximum gauge pressure of about 1 bar or
rL
15 PSI, the equilibrium temperature would be lowered
(4)
overall by 0.007C from that in Figure 7. We note that
40.19G mL
-
.
the liquid volume fraction is quite low for the lower
rL
molalities and suggest that water released in the MC
Although the temperature differences between veins and
curves was primarily supplied by the contaminated
lenses are small, the resulting heat fluxes have impor-
portions of the samples.
The molality CL of a lens is π(rLsinφ/2)2mL/
tant consequences for the ice structure. If the gauge
0.15
Molality = 0.005
0.10
0.001
0.05
0.0001
0.00001
0.000001
0.00
0.10
0.08
0.06
0.04
0.02
0.00
Temperature Depression (C)
Figure 7. Volume fraction of liquid water vs. equilibrium temperature for a
range of vein bulk molalities mv.
6


 Previous Page
