100
Bath Temperature = (0.09C) to (0.08C)
Drying
80
Wetting
60
40
20
0
1
2
3
0
4
Water Removed (cm3 )
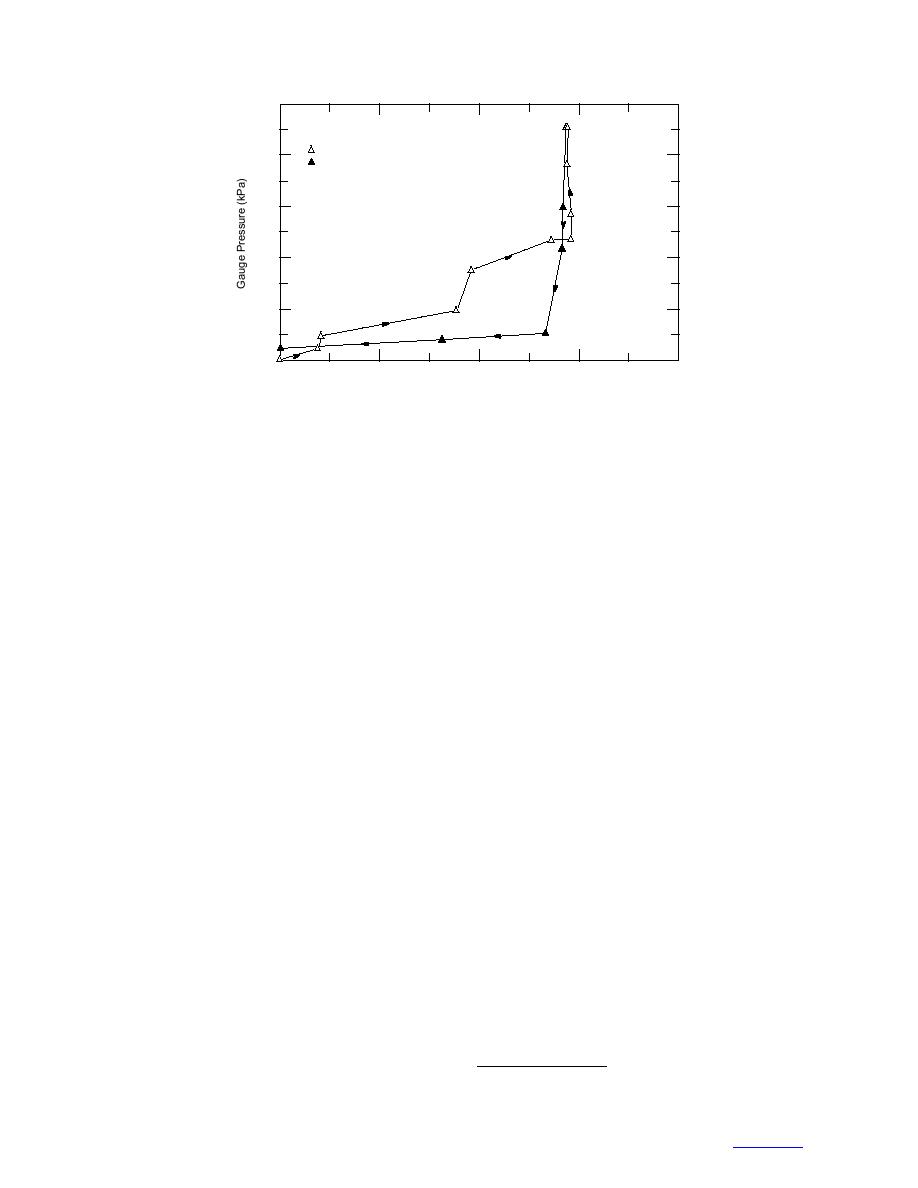
Figure 9. Volume of water exiting (open triangles) and re-entering
(solid triangles) Sample A vs. gauge pressure (pG) for bath
temperatures between 0.09C and 0.08C. The bath temperature
drifted upwards 0.01 to 0.02C at pressure levels of 20 and 47 kPa on
the drying curve.
sample heterogeneity and temperature gradients in the
forced from the ice by changes of water level in the
bath. A total of 2.9 cm3 of liquid was removed from the
pipette. Temperature, pressure level, and water level
sample. The volume fraction vv for clean ice (6.46
were monitored one to three times a day and tempera-
105 moles kg1) is around 0.001 and thus cannot
ture continuously for Sample B.
account for this liquid. A volume fraction of 0.07 for
Figure 9 shows results from the initial run on Sample
the contaminated portion (3.23 103 moles kg1)
A with the bath temperature between 0.09 and 0.08C.
yields 2.2 cm3 of water.* Larger increments in water
The plot shows that ice desaturates and rewets in
at gauge pressures of 22 and 49 kPa correspond to
response to changes in incremental pressure in a fash-
periods of upward temperature drift of 0.01 to 0.02C.
ion similar to unsaturated soil. Temperature fluctuations
of 0.01C and changes in gauge pressure caused struc-
After these occurrences, we reset the bath temperature
to 0.09C. In the reverse direction, Figure 9 shows
tural changes in the ice over the run. In addition, the
water first re-entering the sample at 13 kPa. Recall that
sample was not homogenous. Localized impurities,
our theoretical estimate of water re-entry pressure is
grain size variations, and temperature gradients in the
PWn = 0.1180/dv, which predicts that water will re-enter
bath caused a potentially wide range of vein sizes.
the 12-m veins at a pressure of 10 kPa. Figure 9 thus
Measured temperature gradients in the bath suggest that
the top of the sample was 0.01 to 0.02C warmer than
supports our hypothesis that the MC curve of ice is
highly hysteretic. Re-entry of the remaining 1.6 cm3 of
the bottom. Because of rapid conduction through the
water at a pressure of 5 kPa occurred slowly over a
brass cylinder, sides of the sample were the most sensi-
two-week period, suggesting a low permeability for the
tive to temperature fluctuations. We hypothesize that
ice and possibly a hysteresis effect. With gauge pres-
smaller vein sizes towards the bottom of the sample
sure reduced to 0, an additional 0.5 cm3 of water entered
control the entrance pressure while larger veins and
the sample under the 2 kPa gravitational head over the
nodes in warmer and contaminated regions control the
next two days.
liquid volume.
During the next two weeks we again increased the
Figure 9 shows that air first entered Sample A at a
gauge pressure up to 1 bar. Surprisingly, the water flow
pressure of 5 kPa and water continued to be pulled from
direction was unaffected by this reverse in pressure and
the ice up to a pressure of 57 kPa. Again, we theoreti-
continued to drop slowly at around 0.05 cm3 per day.
cally relate the vein air-entrance pressure to its width
We examine this anomalous behavior and issues con-
as PAv = 0.6600/dv, which suggests a range of vein sizes
of 132 to 12 m. Consistent with this, the Clausius
cerning ice permeability in the next section.
The results of this first experiment were promising.
Clapeyron equation (eq 3) predicts a vein width of 127
m for the clean part of Sample A. Our tenfold range
* Computed as 0.07 222 cm3 (total volume) 0.14 (fraction of dirty
in vein widths is much larger than the twofold varia-
tion observed by Mader (1992a), but possibly reflects
ice).
9


 Previous Page
