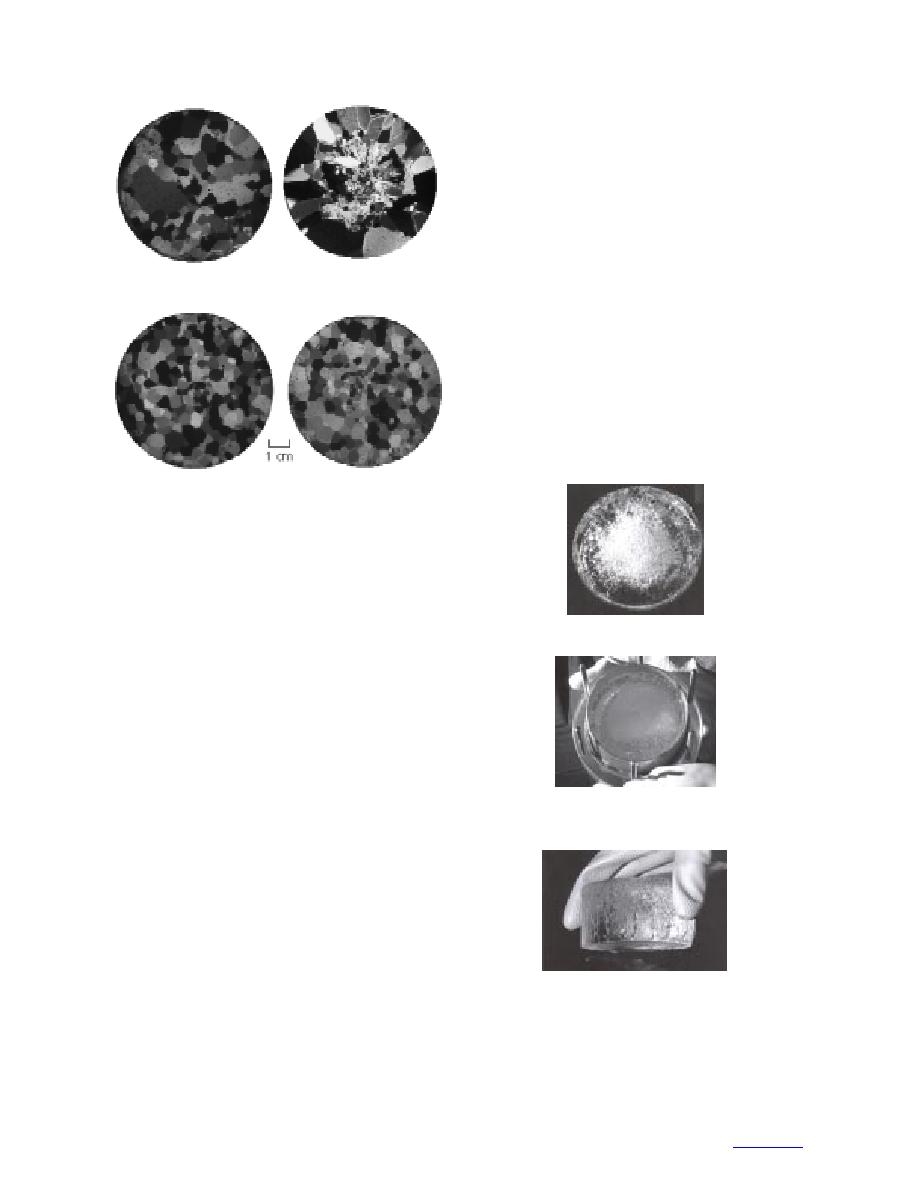
ture. Figures 3ad display the grain cross sections under
polarized light. Prior to sectioning, the ice was stored
for several days at 20C and thus lost most evidence
of rotting. By counting the number of grain-boundary
intercepts per length of randomly oriented lines and
taking the reciprocal, we determined grain sizes (G) of
3.9 mm and 3.2 mm for Samples A and B, respectively.
We melted the remains of the ice samples and meas-
ured the impurities concentration with a Dionex ion
b. Top of Sample A.
chromatograph. This analysis yielded a chloride con-
a. Bottom of Sample A.
centration of 35.8 ppm for Sample A and 5.4 ppm for
Sample B, giving respective bulk molalities of 1.01
103 moles kg1 and 1.52 104 moles kg1. Both con-
centrations were higher than expected for singly dis-
tilled water. The Hanover Water Company, for instance,
reported Cl concentrations of around 0.35 ppm for tap
water at the fire station near CRREL and Mader (1992b)
measured concentrations two to three orders of magni-
tude less for her laboratory-grown samples. Mader,
d. Top of Sample B.
c. Bottom of Sample B.
Figure 3. Thin sections of ice samples under
polarized light.
about 8.3 cm in diameter and 3.6 to 4.3 cm high.
Samples A and B weighed 180 and 222 grams, respec-
tively.
To assemble the Tempe cell, we filled the pipette,
a. Top-down view of Sample A.
tubing, and the attached bottom plate with singly dis-
tilled water near the freezing point. We then moved the
apparatus to a coldroom to add the ice sample and secure
the remaining parts of the cell. To ensure good contact,
we melted the bottom of the ice sample slightly before
placement on the porous stone. During installation,
water rose to fill a small gap between the ice sample
and the 8.6-cm-diameter brass cylinder. After comple-
tion of the experiments, ice samples were returned to
the coldroom and removed from the Tempe cell for
b. Top-down view of Sample
analysis.
B within the Tempe cell.
Figure 4 shows photographs of the rotted ice samples
taken immediately after removal from the ice bath. Both
samples show pronounced grain-boundary grooves with
widths on the order of 1 mm. Grooves initially appeared
more pronounced than in the photographs, perhaps
because refreezing had already started to occur before
the photographs were taken. The bubbly central area in
Sample A indicates that pressurized air entered the ice.
Sample B was somewhat cloudy, but showed no dis-
c. Side view of Sample B with
tinct bubbly regions. Several candled grains along the
its top downward. Note candled
sample sides flaked off with handling (Fig. 4c). Sample
ice grains and possible surface
melting at lower right.
B also evidenced possible surface melting towards the
top of one side.
Figure 4. Rotted ice samples from
We prepared thin sections to analyze the ice struc-
dismantled experiment.
3


 Previous Page
