200
150
100
AFI = 226
50
0
50
100
21 Nov 76
11 Dec 76
31 Dec 76
20 Jan 77
9 Feb 77
1 Mar 77
1 Nov 76
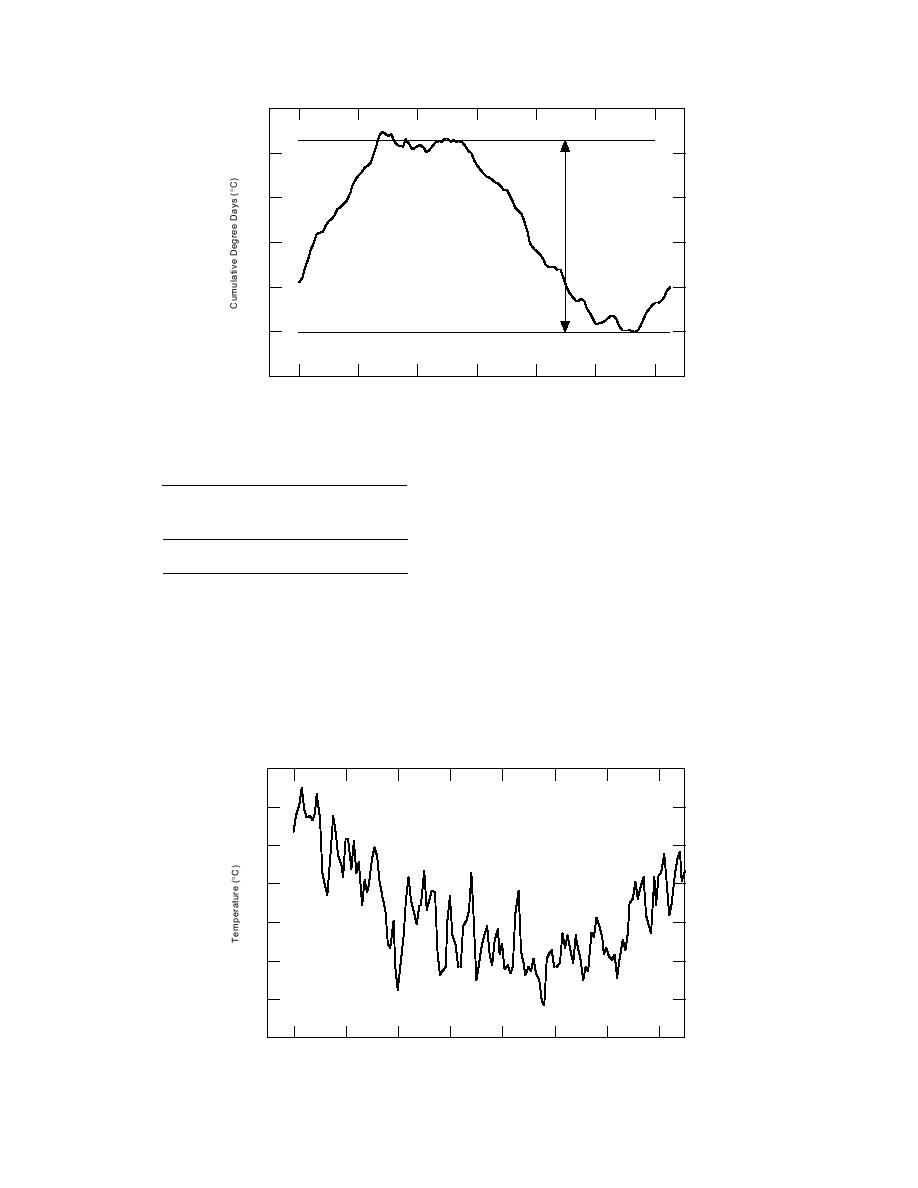
Figure 12. Annual freezing index curve for 197677 freezing season.
272C-days, corresponded the closest to the DFI.
Table 8. Determination of DFI.
The temperature data from the 197778 season
Coldest freezing seasons
AFI value
were used in the computer simulation (Fig. 13). It
199394
291
should be noted that the temperature data used
197778
272
in the computer simulation is slightly colder than
197677
226
the calculated DFI value. This provides a more
Average of three AFI values:
263
conservative estimate for the prediction of frost
Freezing season closest to average: 197778
penetration on the pavement structure. The simu-
lation was run over a 151-day period, simulating
197677 (226) (Fig. 1012). The average of these
the freezing season from 1 November through 31
three coldest freezing seasons was calculated and
March.
the single season with an AFI value closest to the
average AFI is used in the simulations (see Table
8). The DFI is calculated by averaging the values
COMPUTER SIMULATION RESULTS
of the three coldest freezing seasons.
The DFI value was calculated at 263C-days.
640-mm Tilcon subbase material thickness
Both the input and the output files for the
The 197778 freezing season, with an AFI value of
20
15
10
5
0
5
10
15
1 Nov 77 21 Nov 77 11 Dec 77 31 Dec 77 20 Jan 78
9 Feb 78
1 Mar 78
21 Mar 78
Figure 13. Average daily temperature curve for 197778 freezing season.
10


 Previous Page
