0
Asphalt Concrete
100 mm
Gravel Base
200 mm
500
Geosynthetic
Tilcon Material
640 mm
Liner Materials
30 mm
1000
Soil Gas
200 mm
Collection Sand
1500
1400 mm
Cement Treated Waste Material
2000
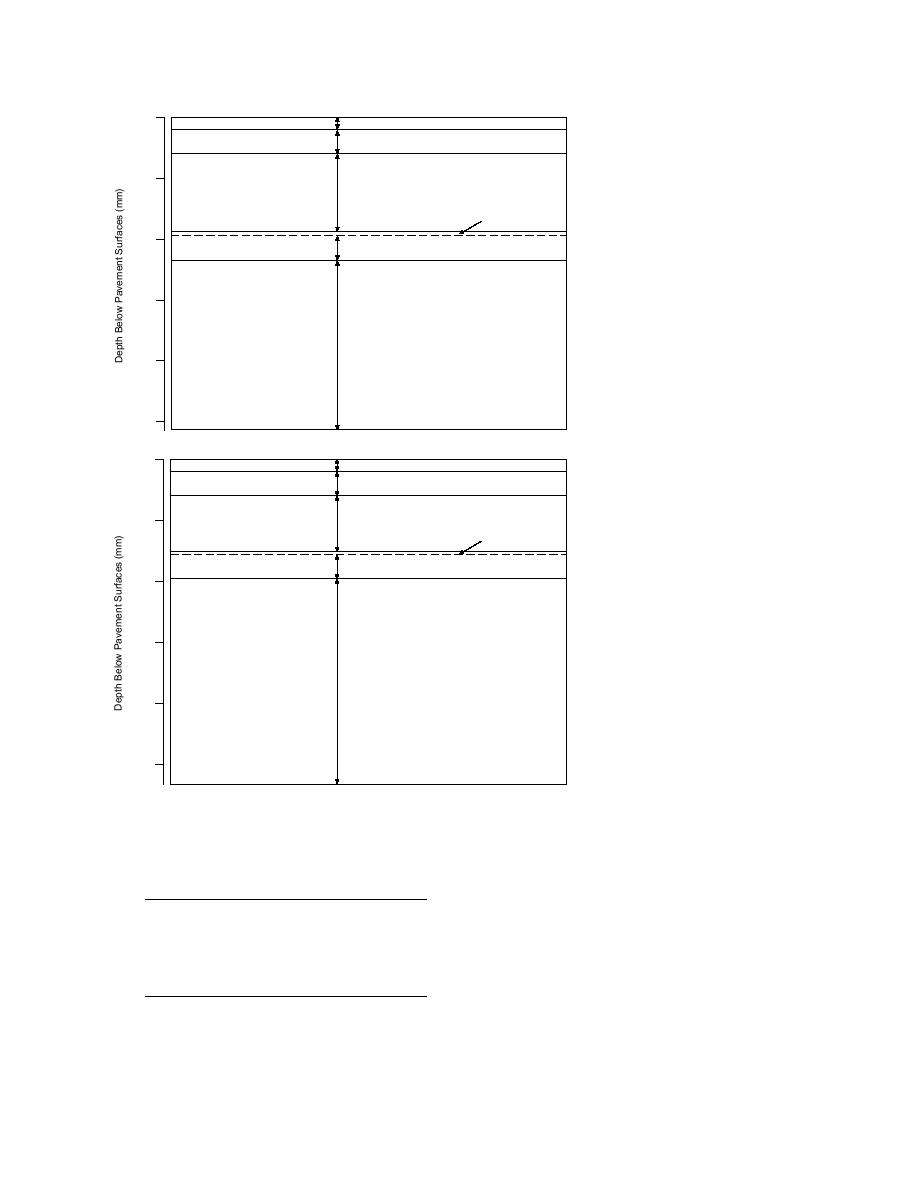
Figure 7. Pavement structure with
640-mm Tilcon layer modeled in
FROST.
2500
0
Asphalt Concrete
100 mm
Gravel Base
200 mm
Geosynthetic
500
Tilcon Material
460 mm
Liner Materials
30 mm
Soil Gas
200 mm
Collection Sand
1000
1500
1680 mm
Cement Treated Waste Material
2000
Figure 8. Pavement structure with
460-mm Tilcon layer modeled in
2500
FROST.
depths farther from the freezing front, the node
Table 2. Criteria for determining frost-
spacing can be farther apart without loss of accu-
susceptibility test.*
racy. The nodes were spaced 40 mm apart
8-hour
Bearing ratio
through the subgrade layer of the waste material.
Frost-susceptibility
heave rate
after thaw
Tables 35 show the number of elemental lengths
classification
Symbol
(mm/day)
(%)
used in each layer in all the simulations.
Negligible
NFS
<1
>20
The first two computer simulations were
Very Low
VL
1 to 2
20 to 15
designed to predict the frost effects in the pave-
Low
L
2 to 4
15 to 10
ment structure with the Tilcon common granular
Medium
M
4 to 8
10 to 5
High
H
8 to 16
5 to 2
fill material through the freezing season. As
Very High
VH
>16
<2
shown in the laboratory frost heave tests, the Tilcon
*Typical CBR for fine-grained soils such as clays, silts,
material, when saturated, may be considered a
and fine sands usually range between 3% to 15%.
highly frost-susceptible material. Since the graded
Coarser materials (sand-silt-clay combinations and
aggregate base has a lower frost-susceptibility,
gravelly sand) range from 10% to 40%. Gravelly clays,
gravel-sand mixtures, and well-graded gravels can
the depth was increased from 203 to 560 mm to
range between a CBR of 20% to 80%.
6


 Previous Page
