0
Asphalt Concrete
100 mm
Gravel Base
560 mm
500
Geosynthetic
Tilcon Material
360 mm
Liner Materials
30 mm
1000
Soil Gas
200 mm
Collection Sand
1500
Cement Treated Waste Material
1240 mm
2000
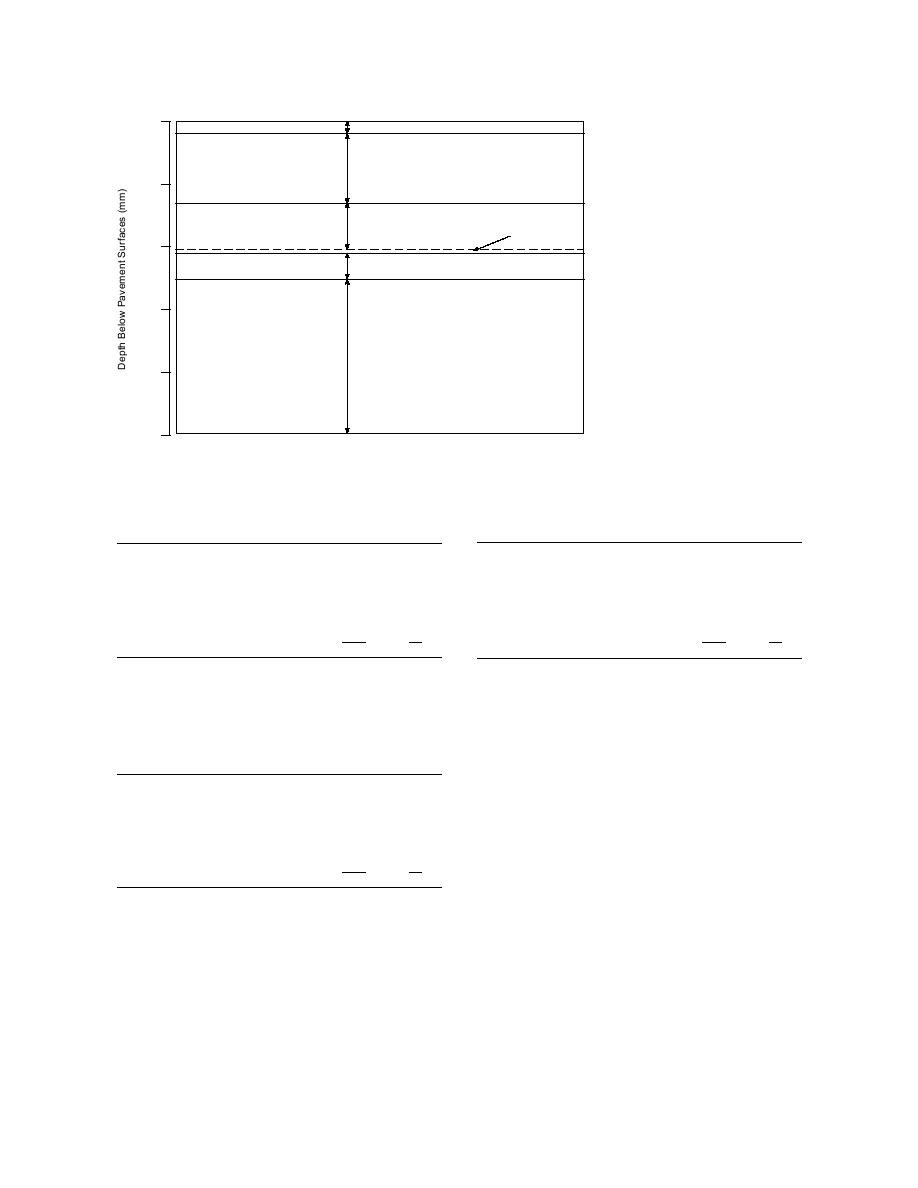
Figure 9. Pavement structure with
560-mm graded base modeled in
FROST.
2500
Table 3. Distribution of elements through pave-
Table 5. Distribution of elements through pave-
ment structure, 640-mm Tilcon subbase layer.
ment structure, 560-mm base course layer.
Thickness
Thickness
Layer
of layer Number of
Layer
of layer Number of
number
Layer type
(mm)
elements
number
Layer type
(mm)
elements
1
Asphalt concrete
100
5
1
Asphalt concrete
100
5
2
Graded aggregate base
200
10
2
Graded aggregate base
560
28
3
Tilcon common granular fill
640
32
3
Tilcon common granular fill
360
18
4
Geosynthetic liner materials
30
1
4
Geosynthetic liner materials
30
1
5
Soil gas collection sand
200
10
5
Soil gas collection sand
200
10
6
Cement-treated waste material
1400
35
6
Cement-treated waste material
1240
31
Total
2570
93
Total
2490
93
Table 4. Distribution of elements through pave-
the estimated rate of frost heave, and both the
ment structure, 460-mm Tilcon subbase layer.
frost and thaw depths. Details of the model are
addressed in Guymon et al. (1993). Further expla-
Thickness
Layer
of layer Number of
nation of the input parameters as applied to the
number
Layer type
(mm)
elements
Raymark Superfund site is given below.
1
Asphalt concrete
100
5
2
Graded aggregate base
200
10
Layer thickness
3
Tilcon common granular fill
460
23
Typically, frost penetration occurs in the base
4
Geosynthetic liner materials
30
1
layers, but it may also occur in the subgrade layer.
5
Soil gas collection sand
200
10
Increasing the thickness of the base will typically
6
Cement-treated waste material
1680
44
minimize the amount of frost heave. This is the
Total
2670
93
intent of the last set of computer simulations
where the graded aggregate base layer was in-
determine the effects in the third set of computer
creased from 200 to 560 mm.
simulations.
The pavement structures in which the thick-
Inputs into the FROST model include layer
ness of the Tilcon subbase layer was varied to see
thickness, soil type, soil parameters, water table
the effects on frost heave and penetration. The
location, and air temperature data. FROST then
first uses a 640-mm subbase layer of Tilcon com-
calculates the soil temperature, moisture stress,
mon granular fill below a 200-mm graded aggre-
water content, ice content, and density for each
gate base layer. The second pavement structure
node at each designated time step throughout the
decreases the Tilcon subbase layer from 640 to
simulation period. Output from FROST contains
460 mm.
a daily prediction of the cumulative frost heave,
7


 Previous Page
