Table 7. Example of determining cumu-
lative degree-days. A degree-day is negative
when the average daily temperature is below 0C
lative degree-days.
and positive when the average daily temperature
Average daily
is above 0C (Johnson et al. 1975). An example of
temperature
Degree-days
Cumulative
(C)
(C-d)
the cumulative degree-day calculation is shown
Day
degree-days
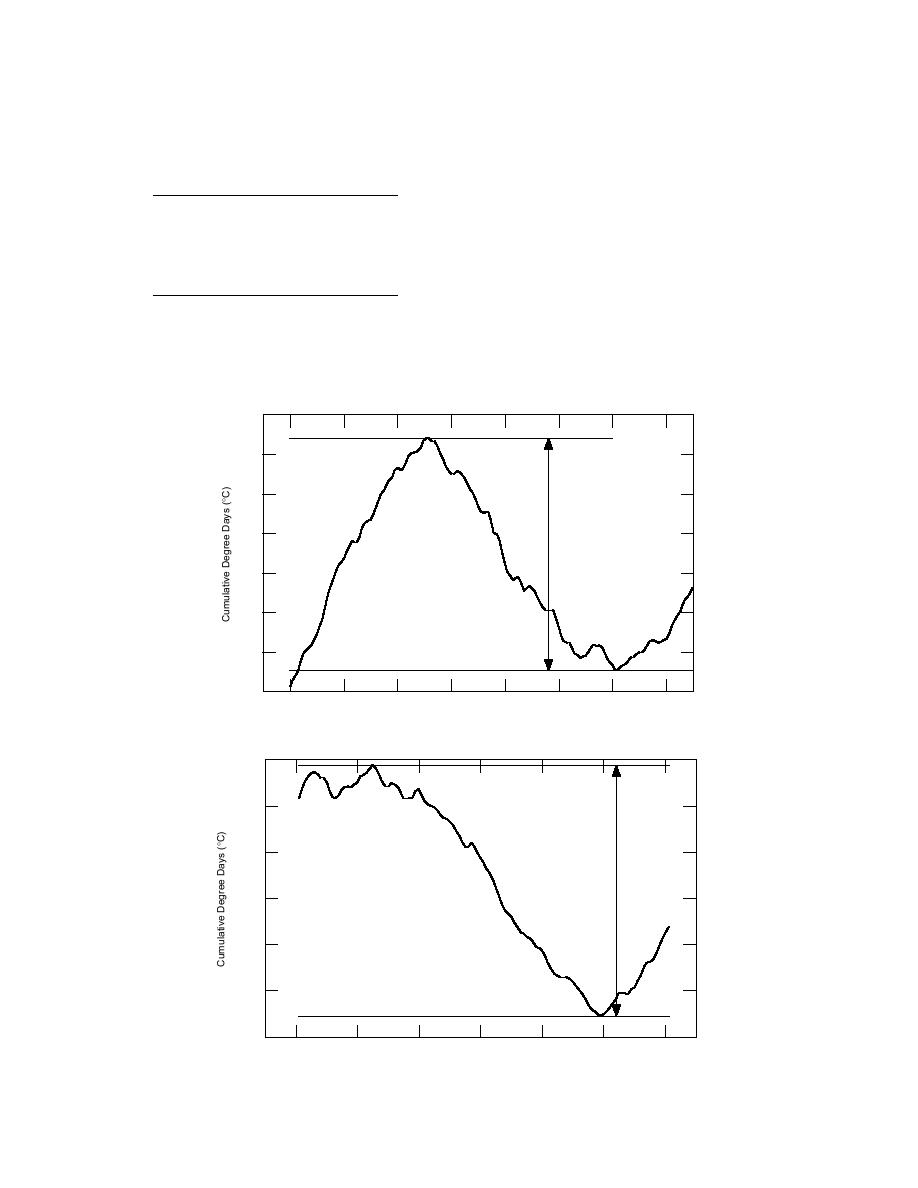
in Table 7. A typical curve of cumulative degree
1
8
+8
8
days as a function of the freezing season for
2
10
+10
18
Bridgeport, Connecticut, is shown in Figure 10.
3
9
+9
27
This freezing curve illustrates the period of time
4
5
+5
32
5
3
+3
35
prior to and throughout the freezing season until
6
2
+2
37
thaw occurs. The annual freezing index (AFI) is
the numeric difference between the maximum
ford, Connecticut. For each freezing season,
and minimum locations of the curve. A larger AFI
which typically ranged from 1 November
value indicates a season with lower tempera-
through 31 March, an average daily temperature
tures. For Bridgeport, the three highest AFI val-
(C) was determined and used to calculate cumu-
ues occurred in 199394 (291), 197778 (272), and
350
300
250
AFI = 291
200
150
100
50
0
1 Nov 93 21 Nov 93 11 Dec 93 31 Dec 93 20 Jan 94
9 Feb 94
1 Mar 94
21 Mar 94
Figure 10. Annual freezing index curve for 199394 freezing season.
50
0
AFI = 272
50
100
150
200
250
30 Nov 77
20 Dec 77
9 Jan 78
29 Jan 78
18 Feb 78
10 Mar 78
30 Mar 78
Figure 11. Annual freezing index curve for 197778 freezing season.
9


 Previous Page
