70
Water Table Depth
60
Below Pavement Surface:
100 mm
50
2740 mm
40
30
20
10
0
1 Nov
1 Dec
31 Dec
30 Jan
1 Mar
31 Mar
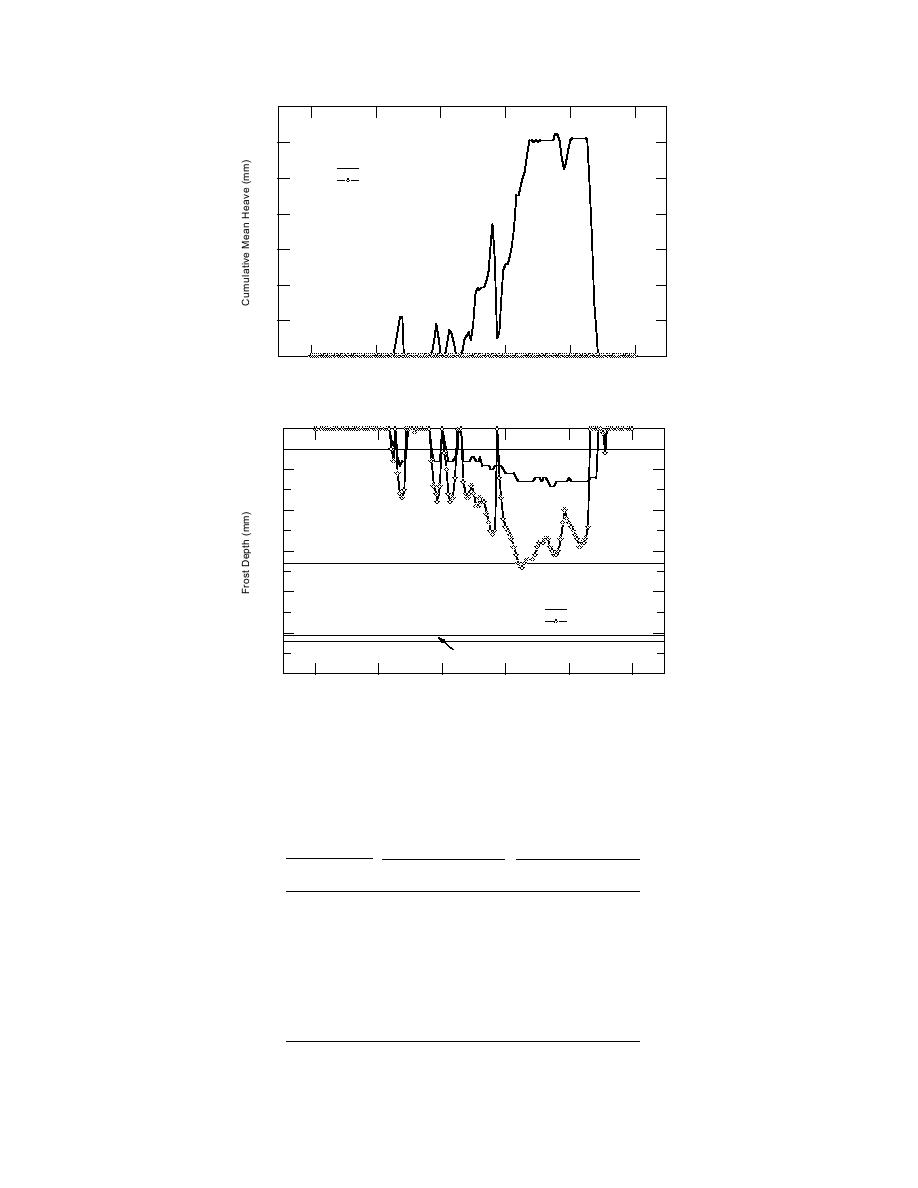
Figure 18. FROST prediction of cumulative mean heave--560-mm base layer.
0
Asphalt Concrete
200
Graded
Aggregate
400
Base
600
Water Table Depth
Tilcon Common
800
Below Pavement Surface:
Granular Fill
100 mm
Material
2740 mm
1000
Geosynthetic Liner Materials
Waste Material
1200
1 Dec
31 Dec
30 Jan
1 Mar
31 Mar
1 Nov
Figure 19. FROST prediction of frost penetration--560-mm base layer.
Table 9. Summary of frost heave and frost depth pre-
dictions from computer simulation.
Pavement structure with 100-mm asphalt concrete over 200 mm
of graded aggregate base
2740-mm
100-mm
Thickness (mm)
water table depth
water table depth
Tilcon common Frost heave Frost depth Frost heave Frost depth
granular fill
(mm)
(mm)
(mm)
(mm)
640
3.8
500
68
320
460
5.1
500
53
320
Pavement structure with 100-mm asphalt concrete over 560 mm
of graded aggregate base
Graded
aggregate
base
560
0.0
680
61
280
13


 Previous Page
