40
35
30
25
20
15
Sample #5
10
Sample #7
Sample #6
Sample #8
5
0
0
24
48
72
96
120
Conditioning
1st FreezeThaw Cycle
2nd FreezeThaw Cycle
Time (hr)
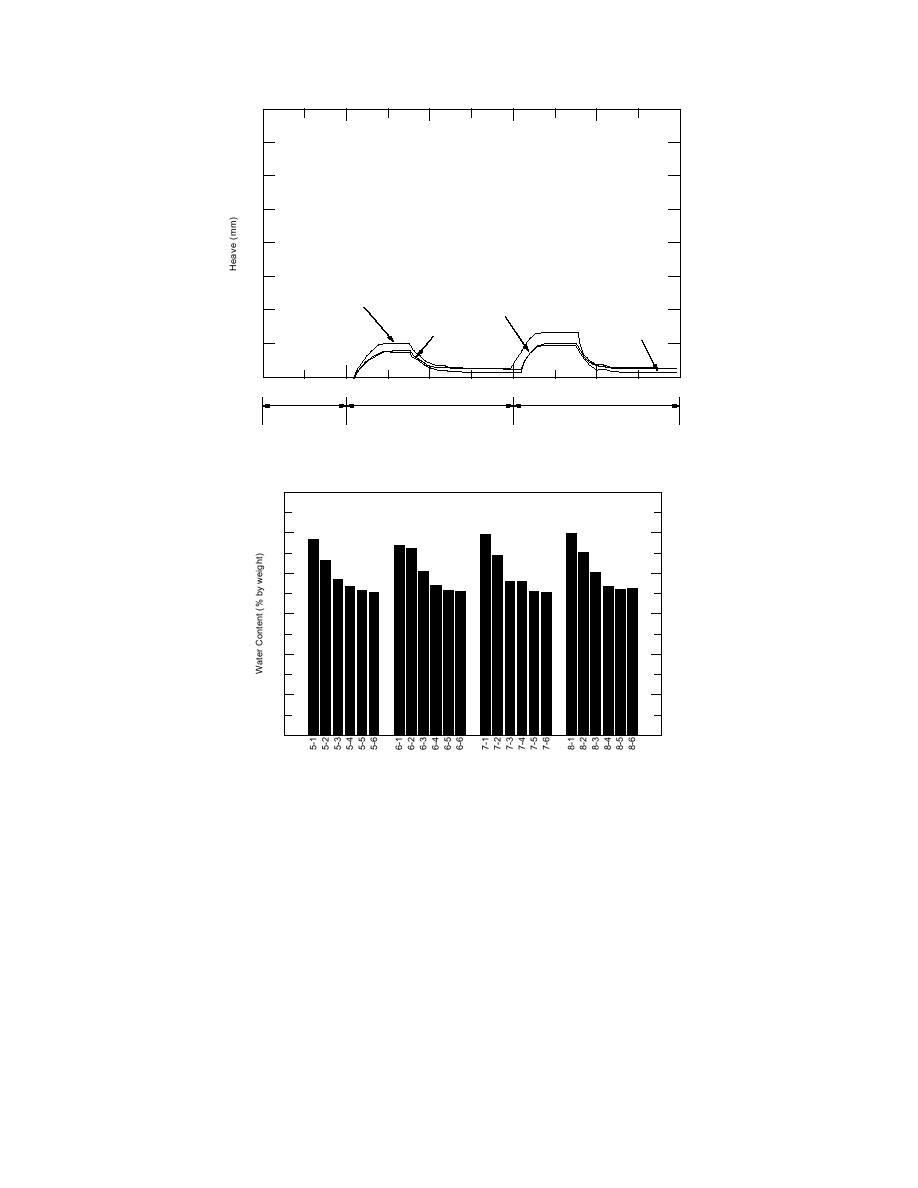
Figure 5. Frost-susceptibility testing for unsaturated soil samples.
12
10
8
6
4
2
0
Sample
Figure 6. Sample moisture profile for unsaturated samples.
mocouple were collected hourly by a Campbell
COMPUTER SIMULATION
Scientific datalogger. This temperature data were
CRREL FROST model
used to monitor frost penetration (Fig. 36).
The amount of frost heave expected at the Ray-
mark site was predicted using the CRREL FROST
model. This is a one-dimensional vertical heat
LABORATORY RESULTS
and moisture flow model. The pavement struc-
The results from the tests are shown in Table 1.
ture, as shown in Figures 79, is discretized into
The qualitative frost-susceptibility system is
nodes: up to 101 nodes or 100 elements. All the
shown in Table 2. For the saturated Tilcon sub-
simulated pavement structures utilized a total of
base soil, based on the rate of heave, the subbase
94 nodes (or 93 elements). For ensured accuracy,
material is classified as a high to very high frost-
node spacing in the freezing front is kept to
susceptible material. In the unsaturated condi-
20 mm apart. The freezing front includes the
tion, the material is classified as a low to medium
pavement layers through the sand gas collection
frost-susceptible material.
layer, below the geosynthetic liner materials. At
5


 Previous Page
