0.008
0.007
0.006
0.005
0.004
0.003
46 applications per day
0.002
0.001
7 applications per day
0.000
0
50
100
150
200
250
300
350
400
Time (days)
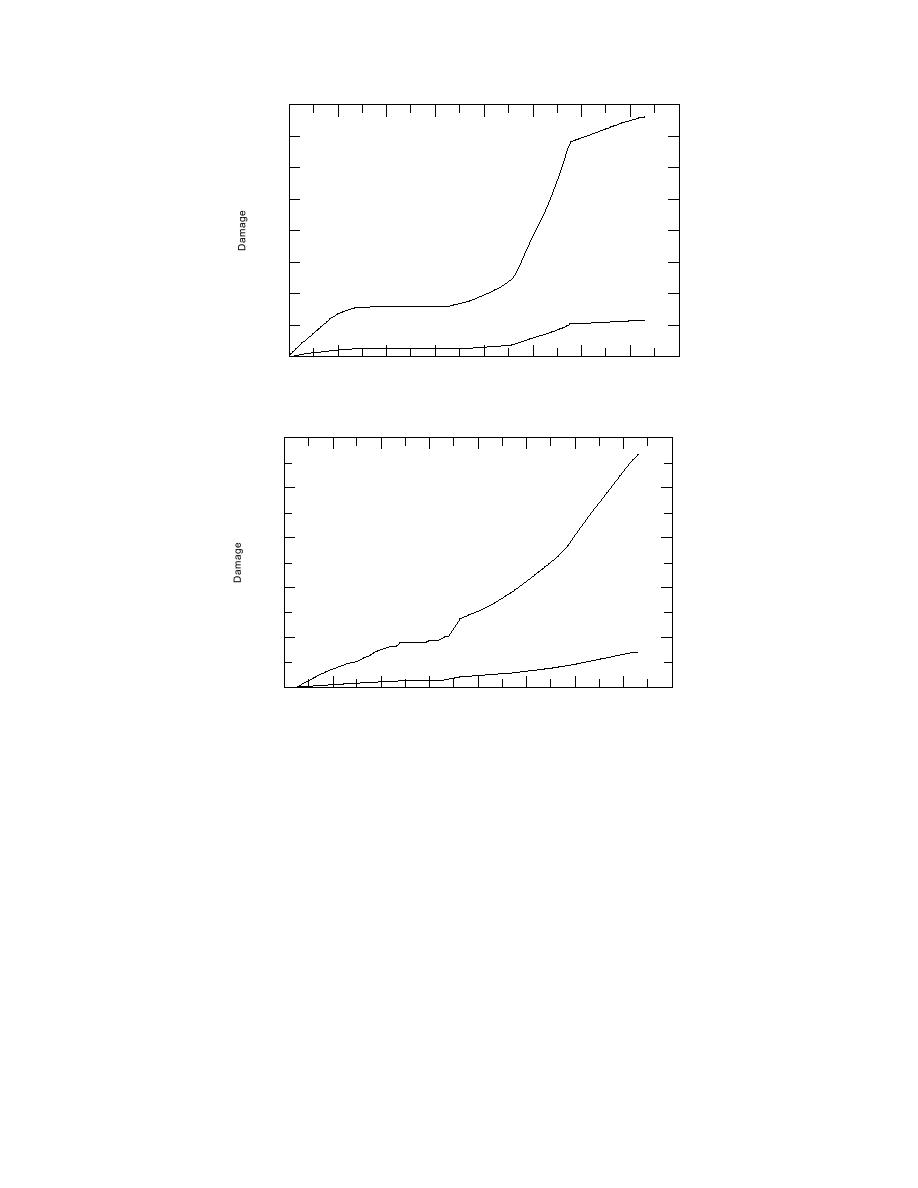
Figure 20. Cumulative damage for first year--at bottom of pavement.
0.010
0.008
0.006
46 applications per day
0.004
0.002
7 applications per day
0.000
0
50
100
150
200
250
300
350
400
Time (days)
Figure 21. Cumulative damage for first year--at top of subgrade.
The results from the computer simulations
LITERATURE CITED
agree with the laboratory findings. Estimates of
American Society for Testing and Materials (1996)
frost heave based on the CRREL FROST model
Standard test methods for frost heave and thaw
and assumed material properties indicate very
weakening susceptibility of soils. American Soci-
minimal frost heave (< 10 mm) under in-situ
ety for Testing and Materials, West Consho-
moisture conditions. If for some unforeseen rea-
hocken, Pennsylvania, D-5918-96.
sons, the pavement structure soil becomes satu-
American Society for Testing and Materials (1996)
rated, as demonstrated by modeling a worst case
CBR (California Bearing Ratio) of laboratory-
scenario, the amount of frost heave estimated
compacted soils. American Society for Testing
was in the vicinity of 5070 mm.
and Materials, West Conshohocken, Pennsylva-
Finally, the results from the damage calcula-
nia, D-1883-94.
tions suggest that the pavement structure will not
Casagrande, A. (1931) Discussion of frost heaving.
fail from either fatigue or subgrade rutting dur-
Highway Research Board, Proceedings, p.168172.
ing its design life.
Guymon, G.L., R.L. Berg, and T.V. Hromadka
(1993) Mathematical model of frost heave and
15


 Previous Page
