20
The coarse nature of the class 6 ma-
terial required a modification of the
Dense Graded Stone:
sample preparation procedure described
V-3
16
V-4
by Ingersoll (1981). An 1/8-in. (3-mm)
VII - 3
VII - 4
layer of coarse sand was placed at the
12
contact with both the lower and upper
porous plates of the test cell to allow
proper capillary action at these inter-
8
faces. It is extremely difficult to obtain
accurate data at tensions near satura-
tion on the class 6 material because it
4
drains so easily. Be aware, then, that
the low tension data points are esti-
mates, while the values at higher ten-
0
20
40
60
80
100
Time (hr)
sions are more accurate. To check that
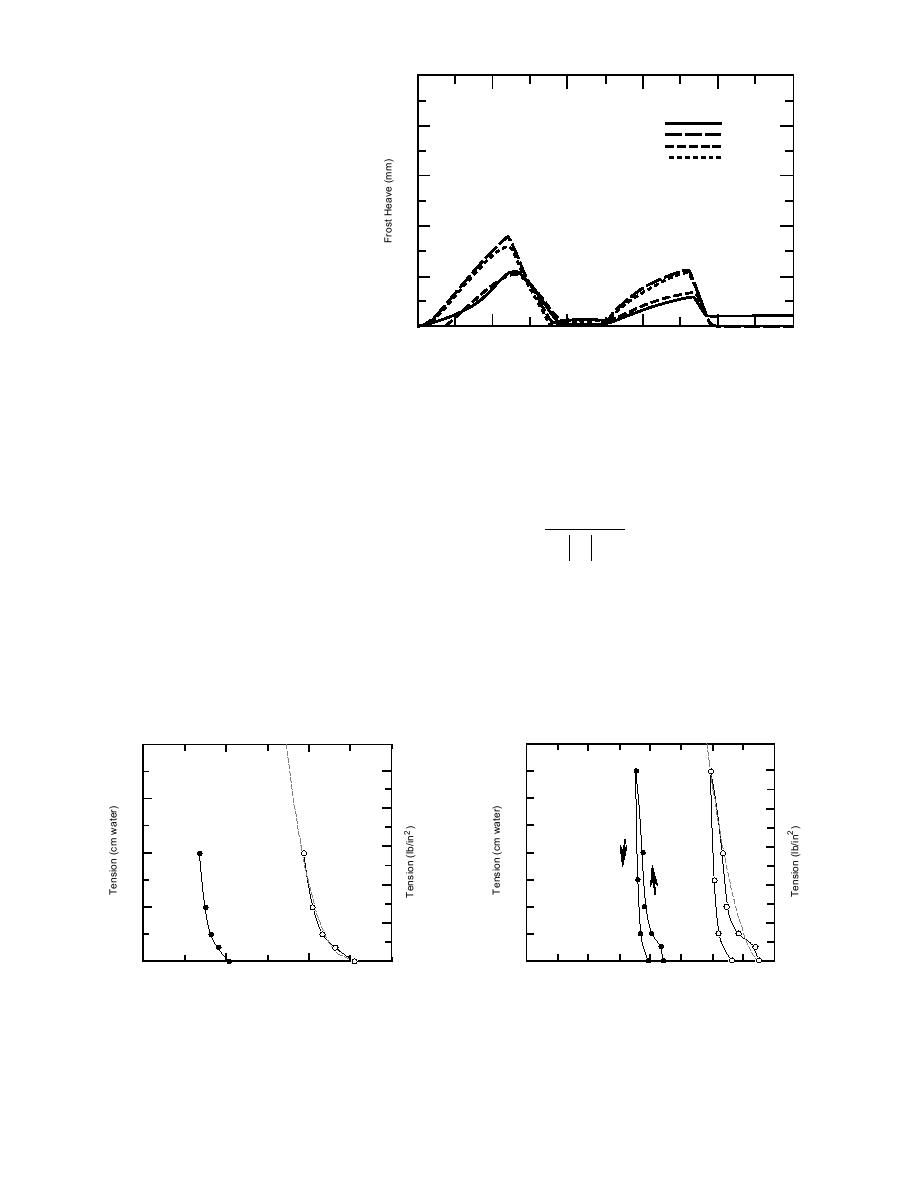
the inserted sand layers were not a large Figure 5. Data from frost susceptibility test on dense-graded
influence on the hydraulic test, a con- stone (from Chamberlain 1986).
ventional saturated permeability test
was also run on the class 6 special material. The
represent the calculated values used in the mecha-
result was 6.0 cm/hr, which compares favorably
nistic design procedure to approximate the data
with 4.7 cm/hr from the pressure cell permeameter.
using an equation in the form of Gardner's (1958),
A final note is that the test on the subgrade
as follows:
sample 1171 was terminated during the extraction
θo
θu =
phase because an unknown amount of water was
α
(1)
Aw hp + 1
lost. Extraction values are also the only data avail-
able for the class 3 special blended subbase, class
where θu = volumetric unfrozen water content (%)
6 special blended base, dense-graded stone base,
θo = soil porosity (%)
and taxiway A subbase.
hp = pore pressure head (cm of water)
Figure 6 shows results of the moisture retention
Aw = Gardner's multiplier for the moisture
tests expressed both as weight and volumetric per-
characteristics
centages. To view the results in terms of tension
α = Gardner's exponent for the moisture
in kilopascals, divide the centimeters of water units
characteristics.
by a factor of 10. The dashed lines in Figure 6
800
800
Sample 1206 (565)
Sample 1171 (563)
γ d = 1.690 Mg/m3
γ d = 1.742 Mg/m3
10
10
G s = 2.70
G s = 2.70
Volume
600
600
Weight
8
8
6
6
400
400
Weight
4
4
Volume
200
200
2
2
0
0
0
10
20
30
40
0
10
20
30
40
Water Content (%)
Water Content (%)
a. Subgrade sample 1171 (563).
b. Subgrade sample 1206 (565).
Figure 6. Moisture retention test results. Dashed line represents Gardner's equation approximation of the
extraction data.
12


 Previous Page
