(Mg/m 3) (lb/ft 3)
(Mg/m3) (lb/ft 3)
140
140
2.2
1206 Subgrade
Class 3 Stockpile
2.2
130
135
2.0
2.1
CE - 55
120
130
CE - 55
1.8
S = 100%
110
125
2.0
S = 100%
CE - 12
CE - 12
1.6
100
120
CE - 5
1.9
90
115
1.4
1.8
80
110
10
15
20
25
30
0
5
10
15
20
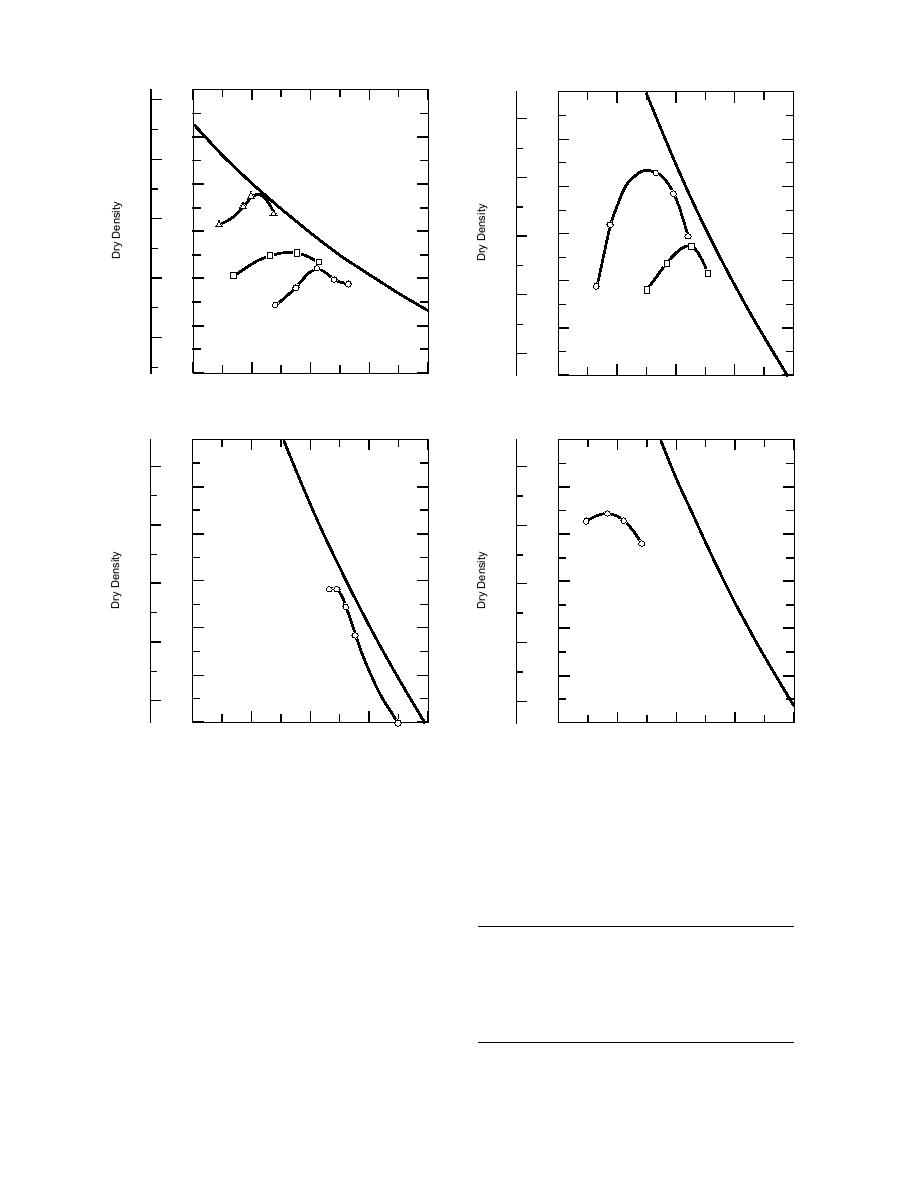
c. Subgrade sample 1206 (565).
e. Class 3 special blended.
140
140
1232 Subgrade
Class 6 Blended
2.2
2.2
135
135
2.1
2.1
130
130
CE - 55
S = 100%
S = 100%
125
125
2.0
2.0
120
120
1.9
1.9
CE - 55
115
115
1.8
1.8
110
110
0
5
10
15
20
0
5
10
15
20
Water Content (%)
Water Content (%)
d. Subgrade sample 1232 (566).
f. Class 3 special stockpile.
Figure 3 (cont'd). Compaction test results.
Table 4. Tentative frost susceptibility criteria
a soil sample to two freezing cycles and determin-
(from Chamberlain 1987).
ing the heave rate during the first 8 hours of each
cycle. The 8-hr heave rate was then converted to
8-hr
Frost susceptibility
heave rate
Thaw CBR
an equivalent heave rate in mm/day. The heave
classification
(mm/day)
(%)
rate from the two cycles can vary significantly,
especially if the soil contains large amounts of
Negligible
<1
> 20
clay. To determine the thaw weakening of the soil
Very low
12
2015
at the completion of the test, a CBR (California
Low
24
1510
Bearing Ratio) test is run on the thawed sample
Medium
48
105
High
816
52
after allowing drainage for 24 hours. The sample's
Very high
>16
<2
frost susceptibility classification is then determined
8


 Previous Page
