2
1
10
10
100
3
10
1
10
4
102
10
3
10
5
10
104
Sample 1232
Class 6 Blended
6
10
5
10
80
85
90
95
100
0
20
40
60
80
100
Degree of Saturation (%)
Degree of Saturation (%)
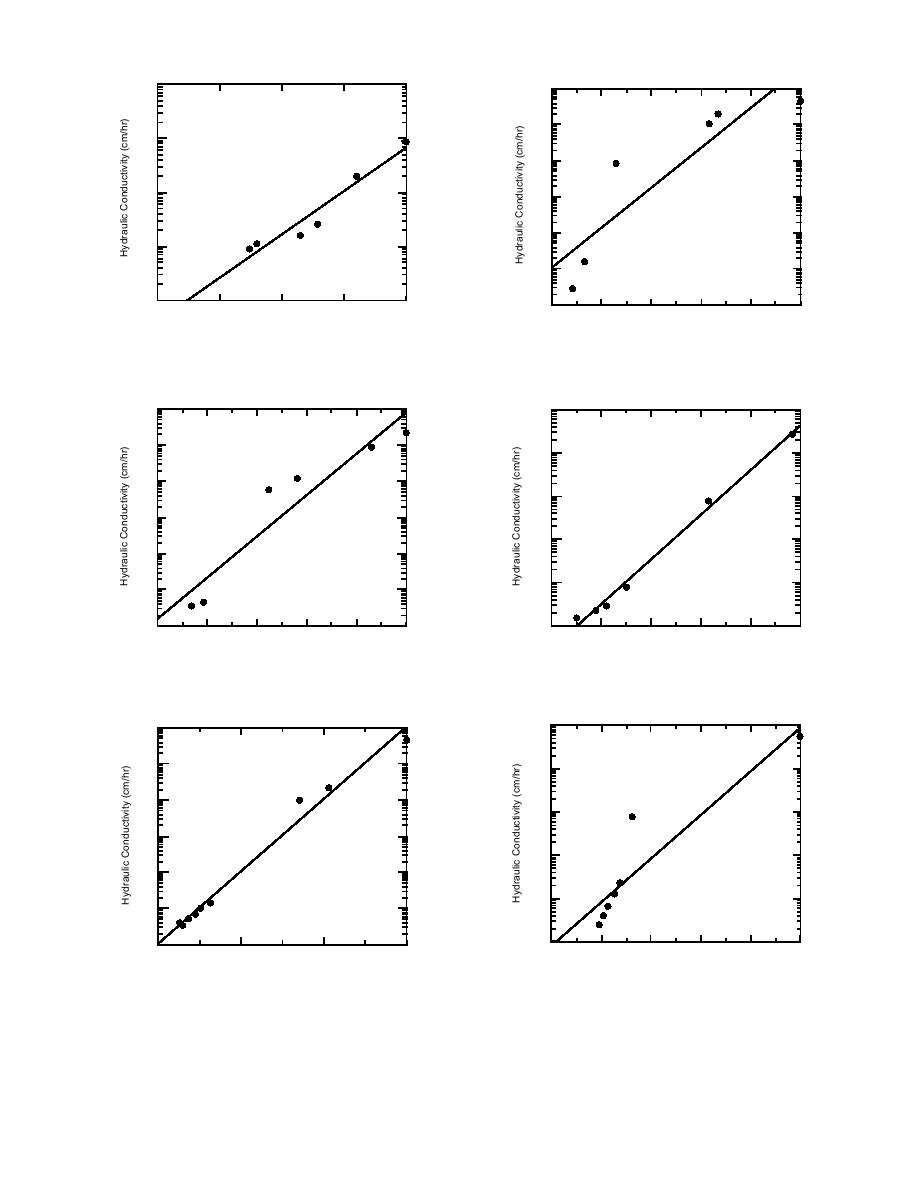
c. Subgrade sample 1232 (566).
f. Class 6 special blended.
1
1
10
10
100
100
1
10
101
2
10
102
3
10
103
4
10
Taxiway A Subbase
Class 3 Blended
5
104
10
50
60
70
80
90
100
50
60
70
80
90
100
Degree of Saturation (%)
Degree of Saturation (%)
g. Taxiway A subbase.
d. Class 3 special blended.
101
1
10
100
100
1
10
1
10
2
10
2
10
3
10
103
4
10
Dense-graded Stone
Class 3 Stockpile
4
5
10
10
0
20
40
60
80
100
40
60
80
100
Degree of Saturation (%)
Degree of Saturation (%)
e. Class 3 special stockpile.
h. Dense-graded stone.
Figure 8 (cont'd). Degree of saturation vs. hydraulic conductivity curves. Solid line is exponential
regression fit to both the extraction and absorption data, when available.
17


 Previous Page
