30
0
Subgrade 1232
δd = 1.78 Mg/m3
25
w = 17.8 %
-40
20
15
-80
10
5
-120
0
-5
-160
0
20
40
60
80
100
0
20
40
60
80
100
Time (hr)
Time (hr)
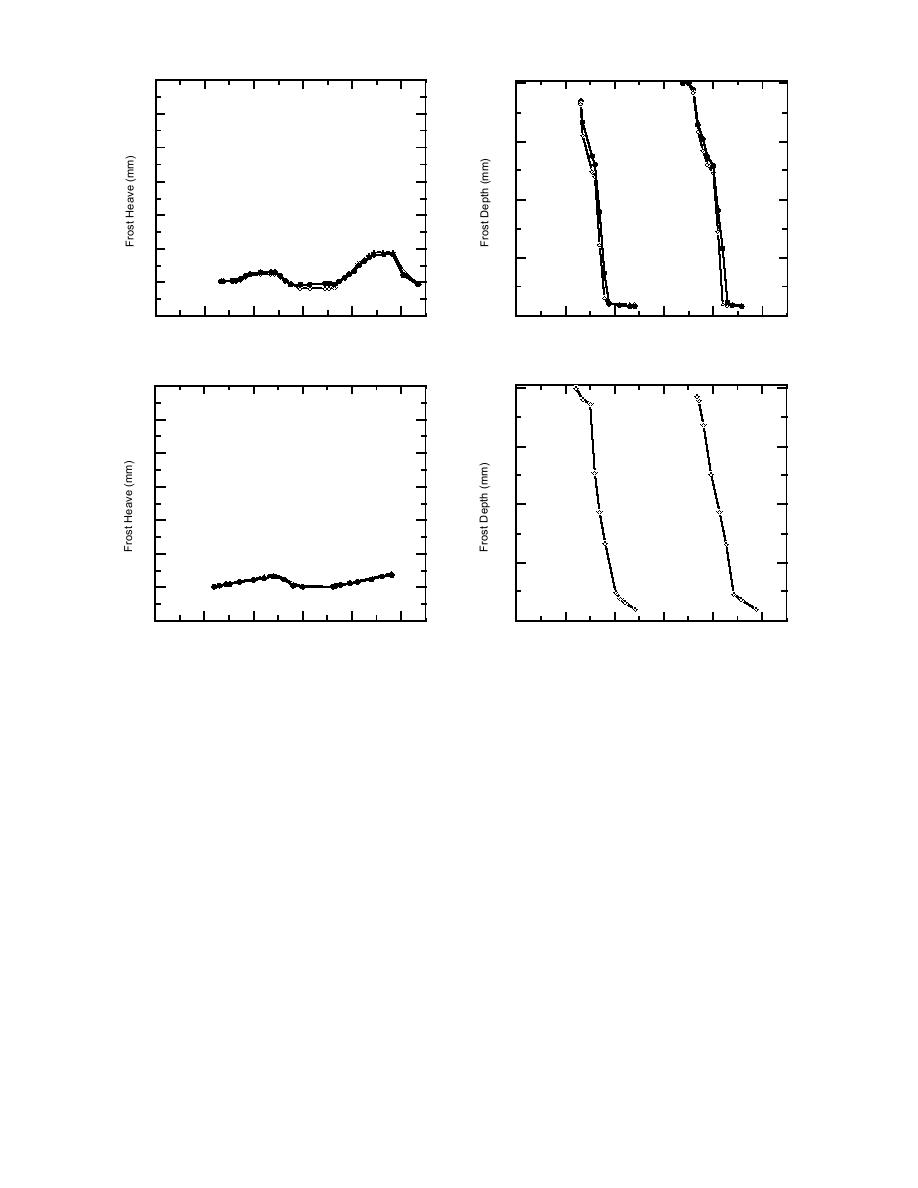
d. Subgrade sample 1232 (566).
30
0
Class 6 blended
δd = 2.11 Mg/m3
25
w = 5.1 %
-40
20
15
-80
10
5
-120
Sample 2
0
Data Not
Recorded
-160
-5
0
20
40
60
80
100
0
20
40
60
80
100
Time (hr)
Time (h)
e. Class 6 special blended.
Figure 4 (cont'd).
Of the two substitute materials, frost suscepti-
test begins with a saturated sample that is dried
bility data are available only for dense-graded stone,
incrementally to determine point values of mois-
as reported by Chamberlain (1986). Figure 5 shows
ture content and pore pressure head, during what
the heave data, which are summarized in Table 5.
is termed the drying or extraction phase of the
The data indicate that the frost susceptibility
test. Incremental amounts of moisture are then
classifications of the subgrades range from me-
reintroduced to the sample in the wetting or ab-
dium to very high. The well-graded class 6 special
sorption phase. At each moisture condition, an
base has negligible frost susceptibility, and the
unstaturated hydraulic conductivity test is also
dense-graded stone (class 5 substitute) ranks as
conducted. Materials tested included subgrade
having medium frost susceptibility.
samples 1171, 1206, and 1232; class 3 special and
class 6 special blended materials; and class 3 spe-
Hydraulic properties
cial stockpile material. Data are also available for
Moisture retention and unstaturated hydraulic
both substitute materials for class 4 special and
conductivity tests were conducted in a pressure
class 5 special. Appendix D contains data from
cell permeameter using the procedures described
the moisture retention and unstaturated hydraulic
in Ingersoll (1981). A typical moisture retention
conductivity tests.
11


 Previous Page
