(Mg/m 3) (lb/ft 3)
(Mg/m 3) (lb/ft 3)
140
140
2.2
Class 6 Stockpile
Class 3 Blended
2.2
130
135
2.0
S = 100%
2.1
130
CE - 55
120
CE - 12
1.8
S = 100%
125
110
2.0
120
1.6
100
CE - 12
1.9
90
115
1.4
1.8
110
80
0
5
10
15
20
0
5
10
15
20
Water Content (%)
Water Content (%)
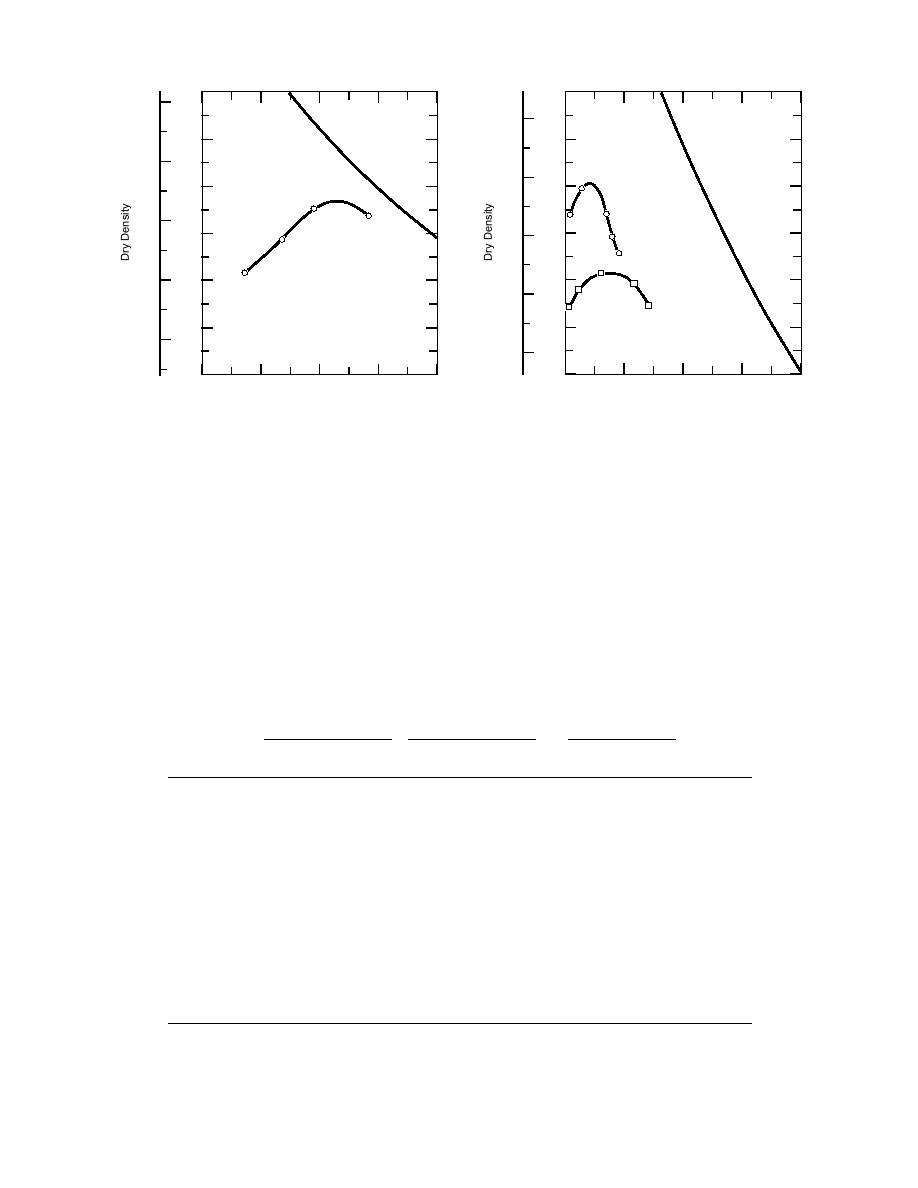
h. Class 6 special stockpile.
g. Class 6 special blended.
Figure 3 (cont'd).
variation of the frost heave and frost depth data
using the criteria shown in Table 4. Results from
recorded during the tests, which are also reported
these tests are used as a relative index rather than
in Appendix C. It should be noted that when
a quantitative predictor of behavior.
samples of subgrade 1206 and 1232 were frozen a
A partial frost susceptibility test was conducted
third time to prepare them for the frozen resilient
on the class 3 special stockpile material, but equip-
modulus testing, both soils heaved at a rate that
ment problems were discovered while running the
would have been considered highly frost suscep-
test, and the results are not presented.
tible. The data suggest that the frost susceptibility
Table 5 summarizes the frost susceptibility
of the subgrade may increase with increasing
test results for the subgrade samples and the class
freeze-thaw cycles.
6 special blended material. Figure 4 plots time
Table 5. Frost susceptibility test results.
1st freeze cycle
2nd freeze cycle
CBR test
Hv rate
Rating*
Hv rate
Rating*
CBR
Rating*
Overall
Material
(mm/day)
(mm/day)
(%)
rating
Subgrade
1171 (563)
1
V. low
7.5
Medium
2
High
Medium
1193 (564)
9.3
High
22.5
V. high
<1
V. high
V. high
1206 (565)
9.3
High
16
High
<1
V. high
V. high
1232 (566)
1
V. low
7.5
Medium
2
High
Medium
Class 5 (dense stone)
Sample 1
3.0
Low
3.0
Low
7
Medium
Low
Sample 2
NF
--
4.3
Medium
11
Low
Medium
Sample 3
5.5
Medium
5.4
Medium
11
Low
Medium
Sample 4
5.3
Medium
5.3
Medium
12
Low
Medium
Class 6
blended
<1
Negl.
<1
Negl.
29
Negl.
Negl.
* Frost susceptibility rating
9


 Previous Page
