the 37 pairs in this group, 27 were within a factor
99
of 4. Overall then, 63 of 84 pairs with only one
98
real value were in acceptable agreement. This situ-
95
ation could obviously be improved with better
90
interlaboratory agreement on reporting limits, but
current agreement is far superior to that for VOCs
and TPH.
70
MS/MSD results were provided in some cases,
especially those from the MRD laboratory. Unfor-
50
tunately, we were unable to correlate those re-
30
sults with QC/QA ratios. We remain unconvinced
that the MS/MSD effort is cost-effective in this
program.
10
There were also eight data reports for the
5
Umatilla Washout Lagoon, submitted by NPD.
All samples showed extremely high RDX and TNT
2
0.8
0.4
0
0.4
0.8
concentrations requiring high dilution prior to
QC
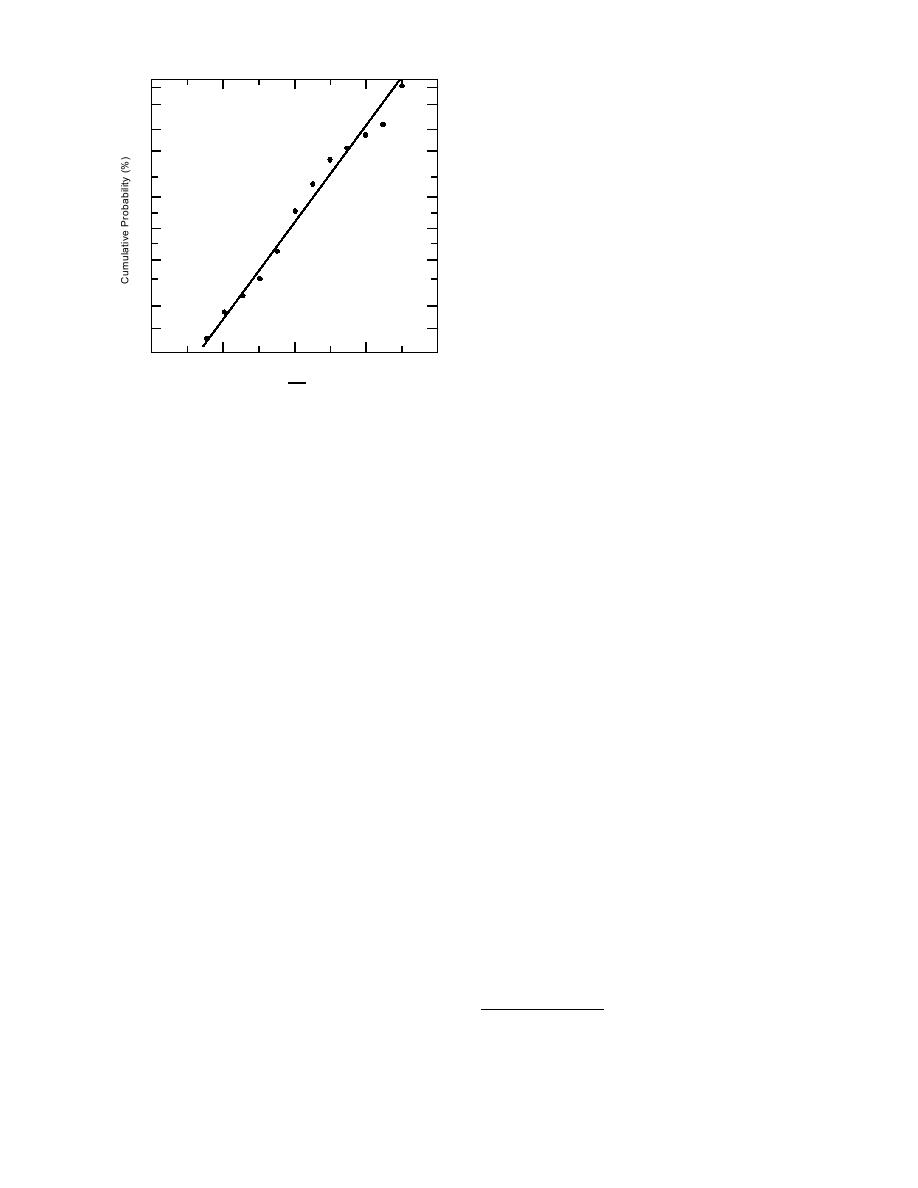
Log of Soil Explosives QA Concentration Ratios
analysis of extracts. Consequently, they were ex-
amined separately. All QA results were generated
Figure 14. Lognormal probability plot for QC/QA con-
by Maxwell S3, San Diego, California, and all QC
centration ratios of explosives in soils with ratios be-
results came from Precision Analytecs, Pullmann,
tween 0.254.00.
Washington. Concentration estimates for TNT
were missing for two QA samples due to high
The geometric mean of the 58 ratios between
dilution. Of the 14 pairs of results (eight RDX, six
0.254.00 was 0.91 with 95% confidence limits of
TNT), 13 gave QC/QA ratios well under 1.00. The
0.78 to 1.06. If we isolate the 40 ratios with Weston,
geometric mean was 0.58 with 95% confidence
West Chester, Pennsylvania, as the QC laboratory,
limits of 0.39 to 0.86. The substantial systematic
the geometric mean for QC/QA is again 0.91.
error between these two laboratories could arise
Consequently, despite the high percentage of ra-
in various ways, including losses due to holding
tios below 1.00, we are unable to demonstrate sta-
time differences. Our research has also shown that
tistically significant bias between the contracted
nitroaromatic compounds are susceptible to bio-
QC laboratories and the MRD QA laboratory. The
degradation (Grant et al. 1995). Sample heteroge-
99% tolerance limits are 0.204.18, slightly wider
neity, incomplete extraction, and calibration dif-
than the editing limits. As before, this minor dis-
ferences are additional potential sources of error.
crepancy is attributed to a slightly imperfect fit of
A recent experiment involving the MRD labo-
ratory and the Cold Regions Research and Engi-
the lognormal model.
neering Laboratory (CRREL) provides evidence
Because a very high proportion of the concen-
to support the potential contribution of such er-
trations are close to method reporting limits, it is
ror sources (Solsky pers. comm.* ). Seventeen soil
not surprising that there were 84 cases where ei-
ther the QC or the QA laboratory reported a real
samples were split in the usual fashion and ana-
value while the other reported "less than." Of
lyzed by MRD and CRREL. A total of 53 pairs of
results was generated for 2,4,6-TNT, 1,3,5-TNB,
these, 47 were cases where the "less than" value
2,4-DNT, RDX, and 1,3-DNB. Seven of the 53 ra-
was smaller than the real value, but many of these
tios for MRD/CRREL were outside the limits 0.25
were in close agreement, e.g., < 0.25 vs. 0.29.
4.00. The geometric mean of the 46 ratios inside
Whenever the real value was within a factor of 4
of the "less than" value, we considered the ratio
of the editing limits was 1.08, with 95% confi-
to be acceptable. For 36 of the 47 pairs in this
dence limits for the mean of 0.951.23, and 99%
group, this criterion was met.
tolerance limits of 0.333.51. These limits are some-
The "less than" value was greater than the real
what narrower than the ones reported for the pre-
value in 37 cases, e.g., < 0.50 vs. 0.39. We used the
viously described MRD results, but they exhibit
same factor of 4 here although it is clear that this
similar characteristics.
factor could be exceeded without disagreement
of the values, e.g., < 5.0 vs. 0.27. The problem
* J. Solsky, U.S. Army Corps of Engineers, Missouri
here is that the "less than" value is too high. Of
River Division, Omaha, Nebraska.
16


 Previous Page
