(16 + 22) (100)
(2 - 0.5) (100)
= 32.8%,
= 7.50% ,
116
20
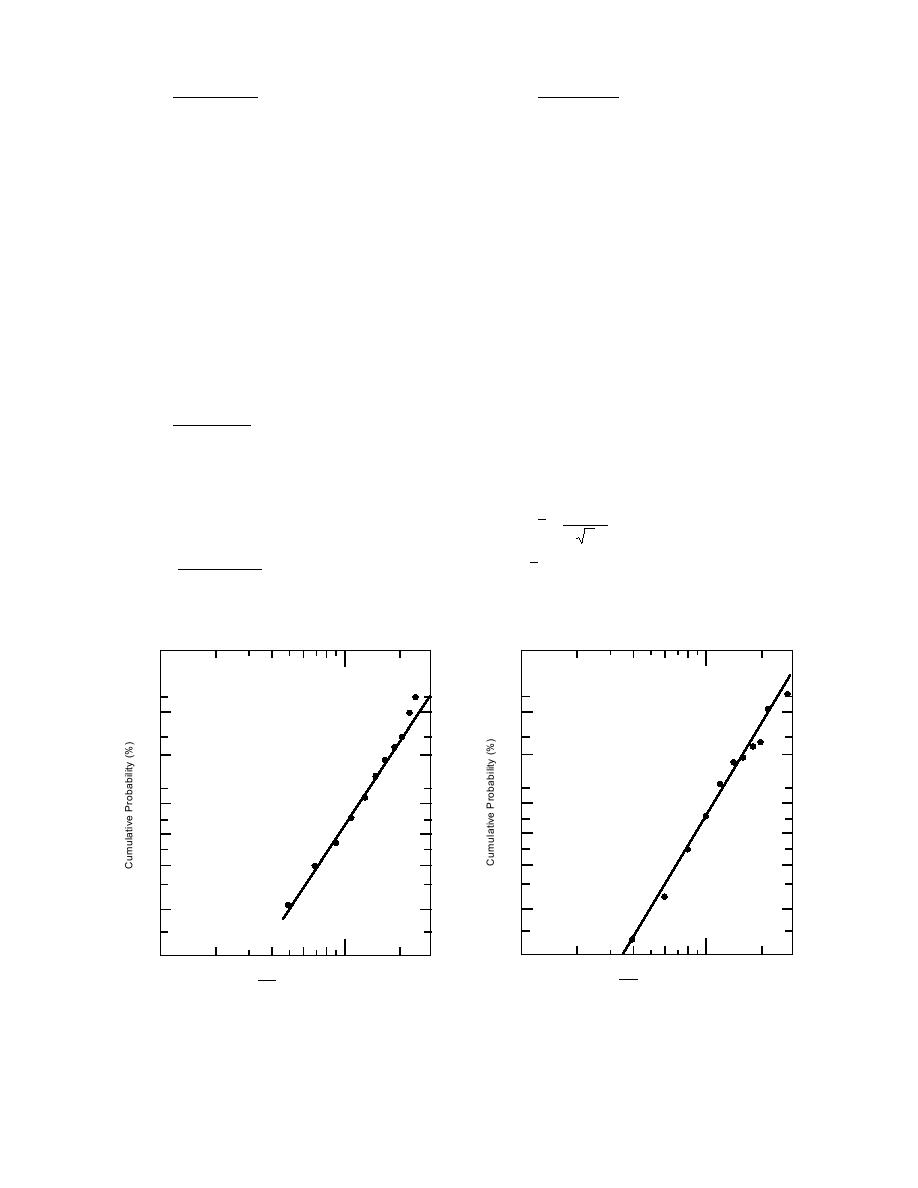
which is plotted vs. 0.795, etc. (see Fig. 2c). Fig-
etc. Benzene (Fig. 2e) has several points at each
ures 2a, 2b, 2c, and 2d are log-cumulative prob-
extreme that deviate a good deal from linearity.
ability plots of QC/QA ratios for soil As, Ba, Cr,
However, a linear probability plot was even less
and Pb respectively. Although a few points devi-
satisfactory. Chloroform and ethylbenzene (Fig.
ate slightly from the linear ideal for lognormal
2f and 2g) fit the lognormal model with only mini-
results, the fits are quite good and justify analyz-
mal scatter while toluene (Fig. 2h) provides a fair
ing the data as being lognormally distributed.
fit. Other VOCs not shown behaved similarly to
Plots for QC1/QC2 ratios behaved similarly, as
the ones shown. In view of these VOC plots, those
expected.
for other analytes, and the expected distribution
Lognormal plots for individual values rather
of ratios, we decided to treat all ratios by the same
than groups are illustrated using four VOCs in
computational procedures. Since the lognormal
groundwater (Fig. 2e2h). Individual rather than
model will be used, we must compute geometric
grouped probabilities were used because of the
means and geometric standard deviations as
relatively small number of ratios. Individual prob-
shown below.
abilities are calculated from
1. Compute QC1/QC2 ratios and their loga-
rithms when QC1/QC2 results are available.
(i - 0.5) (100)
2. Compute mean and standard deviation of
n
the logs.
where n is the total number of ratios in a set and i
3. Compute 95% confidence limits for the mean
is the rank after the ratios are arranged from low-
of the logs according to the equation
est to highest. Thus for 20 ratios ranging from
0.40 to 2.75, the first ranked one (0.40) would be
t
S
x 0.95 x
plotted on the abscissa vs. a probability of
n
(1 - 0.5) (100)
= 2.50%
where x is the mean of the logs, t0.95 is student's
20
t for n1 degrees of freedom (d.f.) and a two-tail
alpha risk of 5% (α = 0.05), Sx is the standard
and the next higher ratio would be plotted vs.
99.9
99.9
98
98
90
90
70
70
50
50
30
30
10
10
2
2
0.10
1.0
3.0
0.10
1.0
3.0
QC
QC
Barium QA Concentration Ratio
Arsenic QA Concentration Ratio
b. Soil/barium ratio.
a. Soil/arsenic ratio.
Figure 2. Lognormal probability plots for soil and for groundwater QC/QA concentration ratios.
3


 Previous Page
