30
e) One hundred and thirty-four data reports
for VOCs in groundwater from the MRD labora-
tory, labeled V2-1 to V2-134, and 23 from the NPD
laboratory, labeled V3-1 to V3-23. These results
20
were from 39 project locations in more than 21
states and involved more than 15 laboratories.
10
DATA COMPARISON
METHODOLOGY
0
The first approach considered was a plot of
QC concentration estimates vs. associated QA es-
timates. This is a very useful comparison tech-
nique. A linear regression line can be fitted by
QC
Cr
Ratios
minimizing the residual sum of squares for the
QA
QC estimates while assuming zero error in the
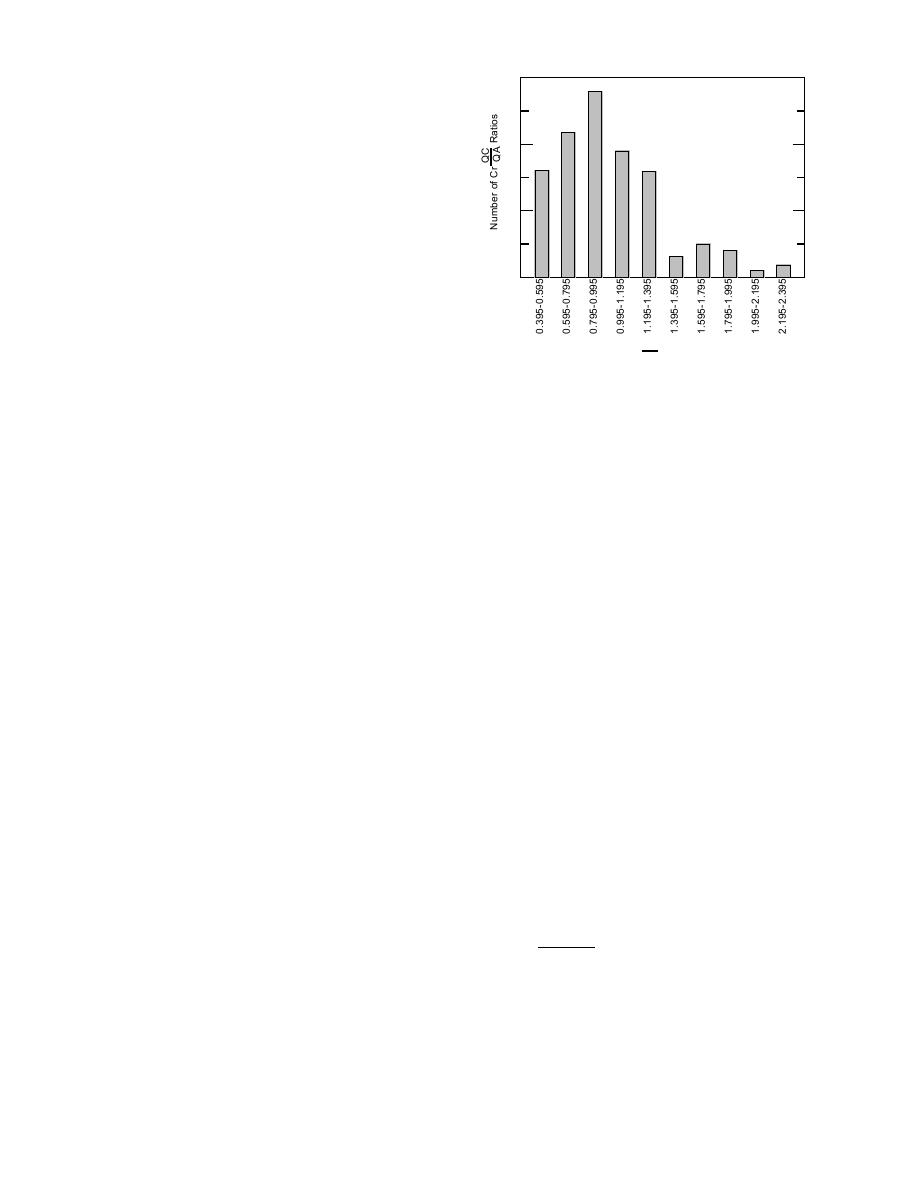
Figure 1. Frequency histogram for soil Cr QC/QA
QA estimates. For an ideal system with perfect
concentration ratios.
agreement between QC and QA values, the fitted
model would be linear through the origin with a
TPH results, the percent exclusions were always
slope of 1.00. The extent of departure from this
less than 13% and often well below 10%.
ideal can be used to calculate confidence limits
We should not expect the QC/QA ratios to be
for individual measurements at some selected
normally distributed using linear coordinates. A
probability level. Confidence intervals for indi-
factor of 2 difference in QC and QA concentra-
vidual measurements are called tolerance bands.
tions would lead to a low side ratio of 0.50 and a
After reviewing the data sets submitted, we
high side ratio of 2.00. Obviously these two val-
decided that the concentration ranges were much
ues are not symmetrically distributed around the
too wide to be fitted to individual models. Fur-
ideal value of 1.00 for perfect agreement. A histo-
thermore, there is no basis for assigning referee
gram of the soil Cr QC/QA results (Fig. 1) shows
status to the QA values, and the data are not nor-
that the typical shape of these distributions is
mally distributed, which is the underlying as-
skewed toward the high end. This histogram sug-
sumption of this approach. It is also likely that
gests that a lognormal distribution should describe
the more complex computations required by this
the results. Simply stated, this means that the logs
approach might impede routine usage. Conse-
of the ratios will form a normal distribution when
quently, we decided to examine QC/QA concen-
plotted as shown in Figure 1.
tration ratios for between-laboratory comparisons
An effective method of testing the hypothesis
and QC1/QC2 ratios for comparison of within-
that the ratios are lognormally distributed is to
laboratory replicates. This approach is similar to
use Lognormal Probability graph paper in which
the first one considered except that no regression
the ordinate is a % probability scale and the ab-
model is fitted. When duplicate QC values were
scissa is a log scale. If the lognormal model is
given, the first listed value was always used for
correct, a straight line will result. To plot the Cr
the QC/QA computation. For metals in soils and
ratios shown in Figure 1, we convert the number
VOCs in groundwater, ratios below 0.30 and
of ratios in each cell to a cumulative probability.
above 3.00 were designated outliers and excluded
From Figure 1 there are 16 ratios between 0.395
from further computations. Because of the larger
and 0.595. Since the total number of ratios was
unavoidable uncertainties attached to the estima-
116, the probability of values in this cell is
tion of low concentration organic analytes in soils,
these limits were expanded to 0.254.00 for TPH
(16) (100)
= 13.8%.
and explosives and to 0.1010.0 for VOCs. While
116
this practice may seem arbitrary, exclusion of a
This value is plotted on the probability scale vs.
very few highly extreme values is necessary to
the upper boundary of the cell, 0.595. The next
avoid unreasonable increases of standard devia-
cell (0.5950.795) contained 22 ratios and the cu-
tions and the associated confidence bands for a
mulative percent was
data set. Except for VOCs in soils and one set of
2


 Previous Page
