99.9
99.9
98
98
90
90
70
70
50
50
30
30
10
10
2
2
0.10
1.0
3.0
0.10
1.0
3.0
QC
QC
Concentration Ratio
Lead
Concentration Ratio
QA
QA
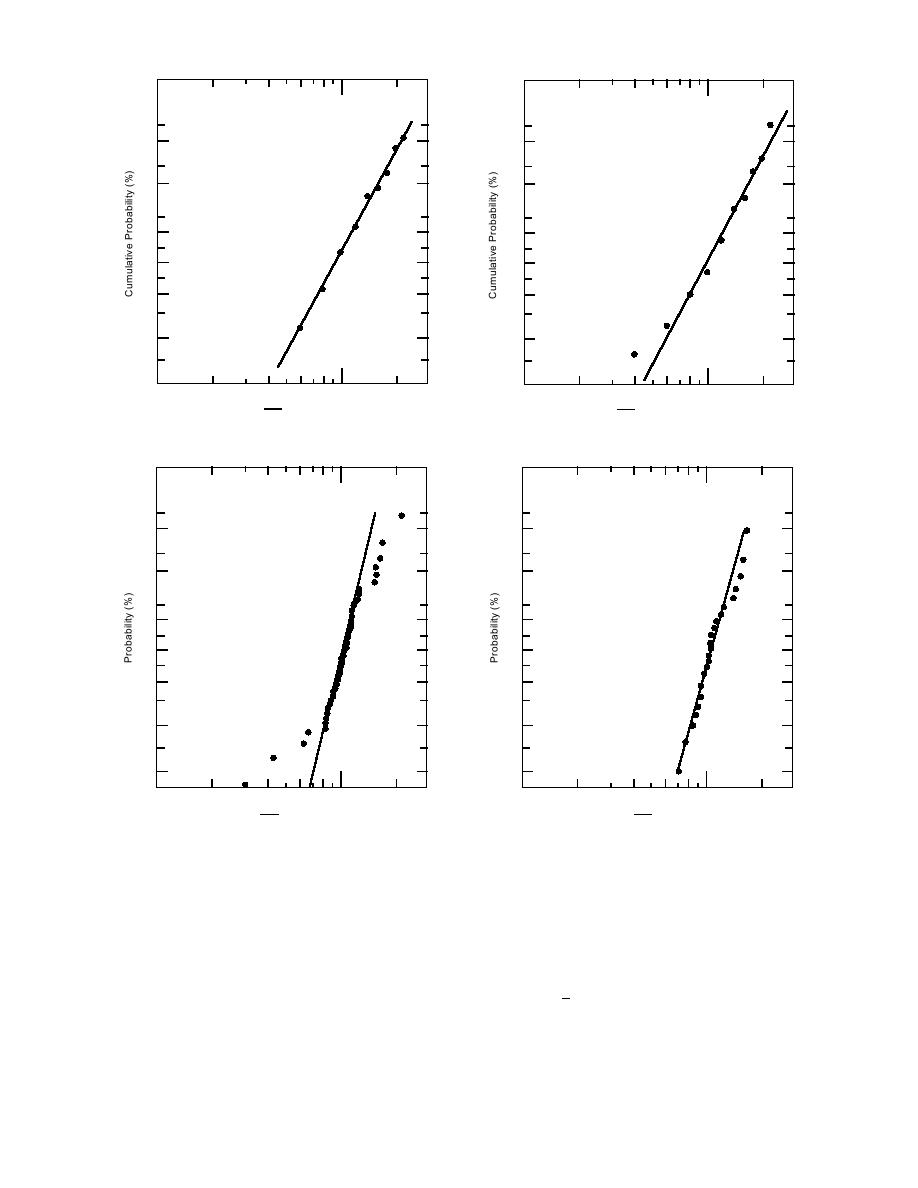
c. Soil/chromium ratio.
d. Groundwater/lead ratio.
99.9
99.9
98
98
90
90
70
70
50
50
30
30
10
10
2
2
0.10
1.0
0.10
1.0
3.0
3.0
QC
QC
Benzene QA Concentration Ratio
Chloroform QA Concentration Ratio
e. Groundwater/benzene ratio.
f. Groundwater/chloroform ratio.
Figure 2 (cont'd). Lognormal probability plots for soil and for groundwater QC/QA concentration ratios.
deviation of the logs, and n is the number of logs
systematic error present. Since the expected true
in the set.
mean for each set of ratios is 1.00, confidence lim-
4. Obtain the antilogs of the mean and the up-
its that do not bracket 1.00 suggest some system-
per and lower 95% confidence limits to see if the
atic bias in the experimental results.
limits bracket the expected mean of 1.00. These
5. Compute 99% tolerance limits for individual
ratios from x t0.99(Sx) for the logs.
confidence limits define a range of values within
which we may reasonably assume (95% probabil-
6. Obtain antilogs for these tolerance intervals
ity in this case) the true value lies if there were no
to see if there are any values outside the limits.
4


 Previous Page
