= 3.020 + 0.300
other words, the wind vector turns. Likewise, eq 150a
for 0 ≤ ≤ 35
(158b)
and 151 suggest that we cannot easily infer the profiles
of U(z) and Θ(z) higher in the ABL from the values at
= 2.85 ( 12.47)1/2
the top of the surface layer.
for 35 ≤
(158c)
Equation 47 defined the geostrophic drag coefficient
Cg as u*/G. To be compatible with the preferred
C() = 12.0 8.335 (1.0 0.03106 )1/3
Ekman-layer scales, rather than defining G as in eq 131,
for ≤ 0
(159a)
here I use
(
)
1/ 2
= 3.665 0.829
G = U2 + V2
^
^
.
(160)
for 0 ≤ ≤ 18
(159b)
Thus, using eq 150, we can express Cg in terms of the A
= 4.32 (
11.21)1/2
and B functions
for 18 ≤ .
(159c)
u*
k
Cg ≡
=
.
(161)
[
]
G
2 1/2
ln(h / z0 ) - A()
+ B()
2
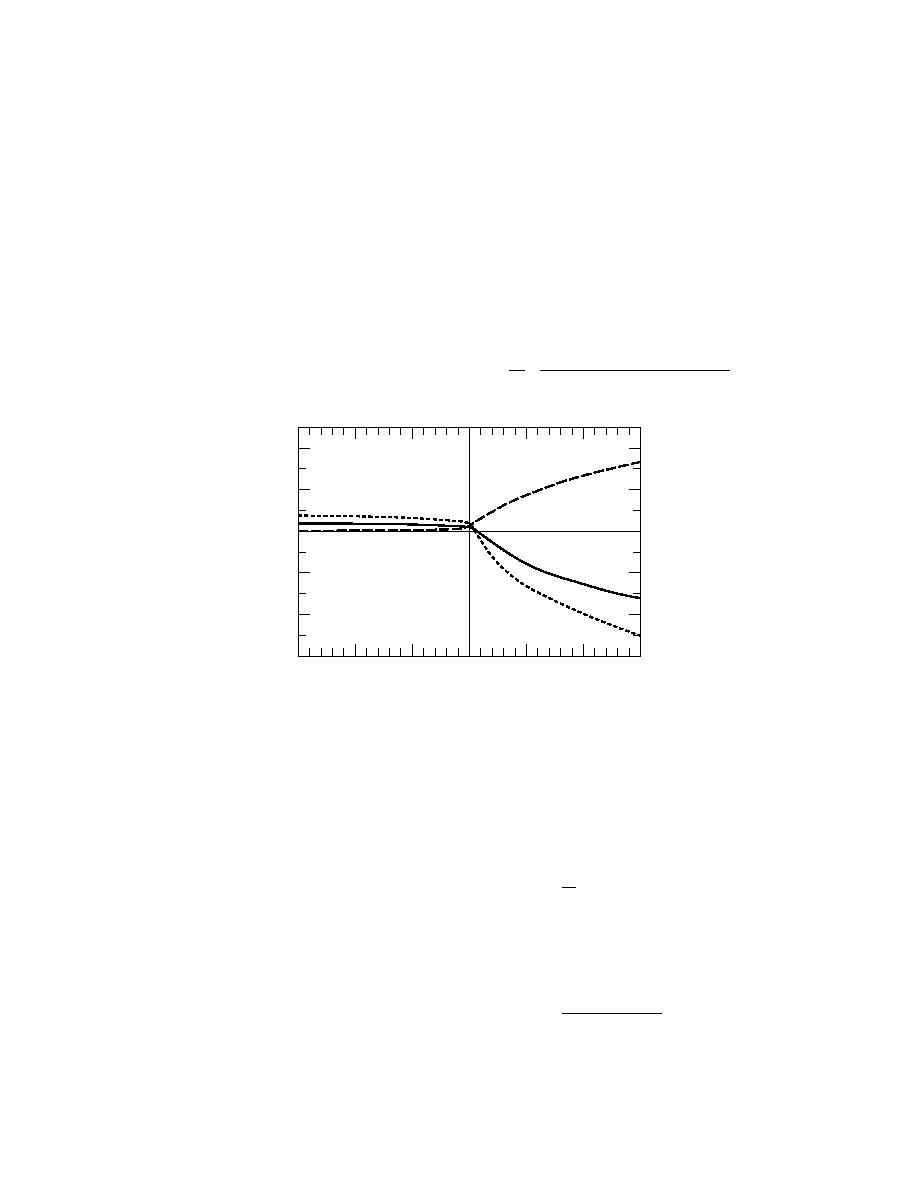
Figure 29 shows plots of these.
40
B
20
0
A
20
40
C
After Yamada (1976)
60
150
100
50
0
50
100
150
= h/L
Figure 29. Yamada's (1976) resistance laws for the longitudi-
nal (A) and transverse (B) velocity components and for the
potential temperature (C) as functions of the stability parame-
ter = h/L (see eq 157159).
Likewise, eq 133 defined the turning angle α. Our
Again, we can interpret the behavior of the curves
in Figure 29 as an indication of the resistance the ABL
Rossby number similarity solutions, however, provide
another definition of α that depends on stability
offers to the vertical transfer of properties. In unstable
conditions ( < 0), A, B and C are relatively small. From
^
V
eq 150 and 151 we thus infer that the ABL is well mixed.
tan α =
(162)
^
Equation 150b shows that there is little turning in the
U
wind between the top of the surface layer and the top
where α is now the turning angle between the surface-
of the ABL. And eq 150a and 151 show a nearly se
layer wind and the vertically integrated geostrophic
^
mi-logarithmic relationship between height and U
wind (see eq 154). Again, from eq 150, we can express
^
nd Θ --the same basic relation found in the surface lay
162 as
r. Thus, again, conditions extant at the top of the surf
-sgnf B()
ce layer continue, with little change, high into the ABL.
tan α =
.
(163)
In the stable half of Figure 29 ( > 0), however, we
ln(h / z0 ) - A()
see the opposite behavior. A, B and C deviate increas-
Figure 30 shows plots of Cg and α as functions of
ingly from zero as the stability increases. Equation
150b thus shows that V becomes significant. In
stability when Yamada's (1976) functions are used for
32


 Previous Page
